Being project manager along with my team Successfully created project by utilizing DMAIC Methodologies and Lean tools
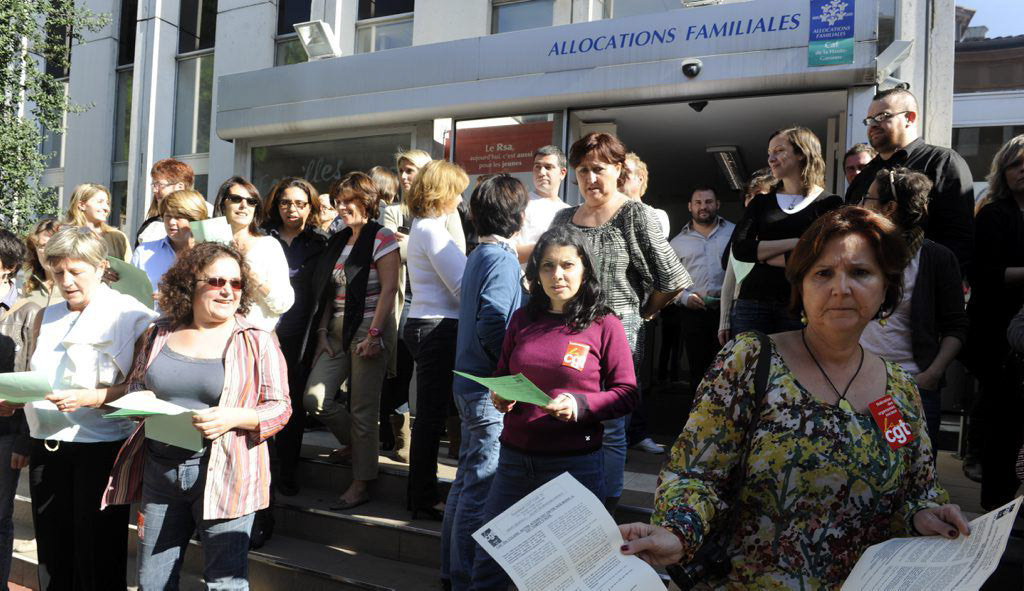
PROBLEM
“More Time Is Spent in CAF Process Than Expected by Customers.”
Customers Are Not Satisfied by CAF Services Because Of The Time Spent in Every Application Process.
Long Lines for The Security Check and Overflowing of Customers in Addition to Lot of Time Wasted in The Waiting Area. From the Office Perspective This Delay Is Leading to More Crowded Lines, More Confusion and Less Customer Satisfaction.
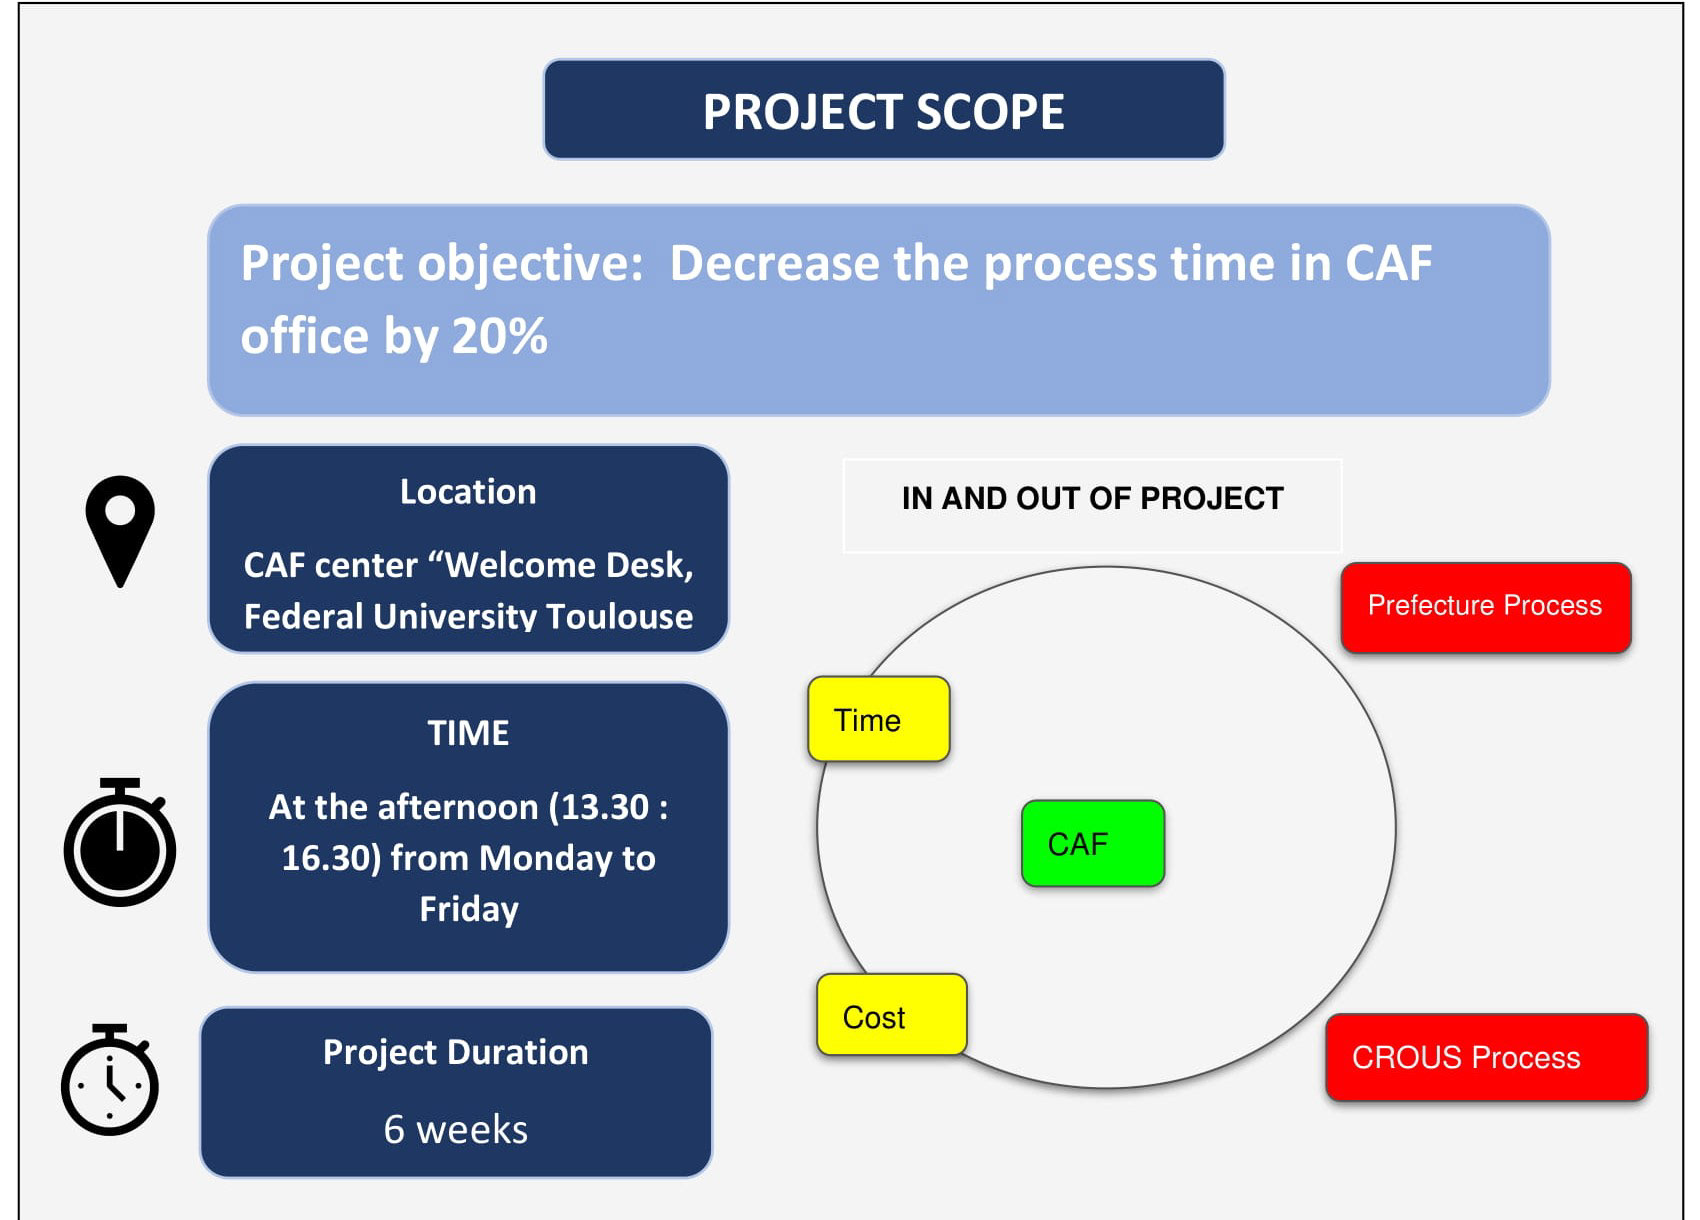
SCOPE
"To Decrease the Waiting Time in CAF Office by 20%"
Location: - “CAF Center “Welcome Desk, Federal University Toulouse”
Time: - At the Afternoon (13.30: 16.30) From Monday To Friday
Project Duration: - 6 Weeks
OBJECTIVES
Our Objective in This Project Is to Rise Customer Satisfaction In CAF Office By Reducing Or Eliminating Non-Value-Added Activities By At Least 20%.
PLAN
We Collect Data For 2 Weeks from Monday To Friday Between (13.30 – 16.30) Each Day Measurements Will Be Taken For 10 Persons At Least.
Each Member in Team Should Record Timing For 1 Day Per Week.
Measurement for All The Process Is Taken As Step By Step With Help Of Stopwatch
IMPACT OF PROJECT ON BUSINESS
Our Project May Impact CAF Office In Various Way Like Improving Efficiency, Increase in Customer Satisfaction, Less Confusion Among Students, And Creating An Pleasant Atmosphere.
TEAM
PROJECT LEADER: - Nitin KALE
TEAM MEMBERS: -
Youssef DERDOURI, Aravindan ARUNACHALAM, Omkar AMBEKAR, and Stephen DONALD ALBERT.
This Video Shows an Actual Situation Of Students Waiting In Waiting Area Of CAF Office.
Project Chatter Excel Sheet Will Help You Understand Project Goals and Objective
Almost Each and Every Lean Tools and DMAIC Methodologies Were Used.
Below You Can See How We Have Approaches and Solved Problem According to Define, Measure, Analysis, and Improve Phase
DEFINE PHASE
SCOPE OF PROJECT
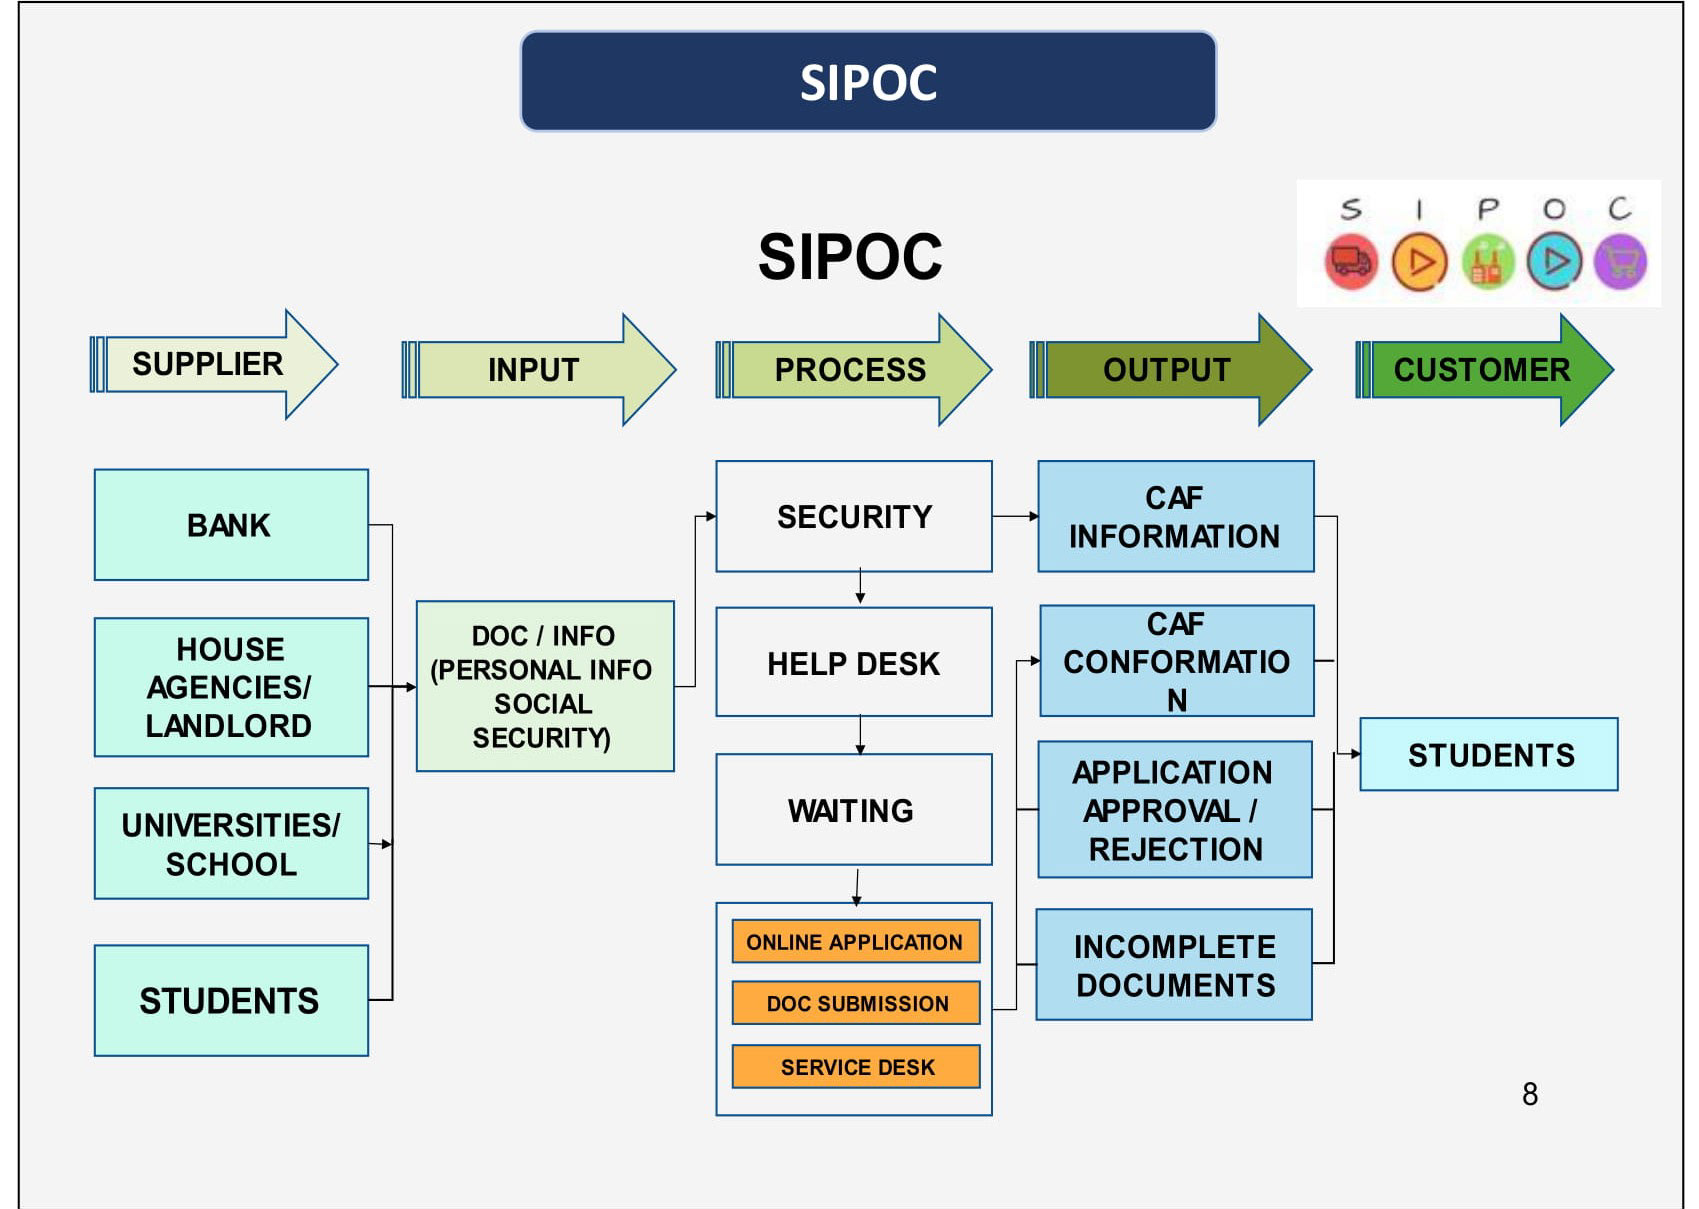
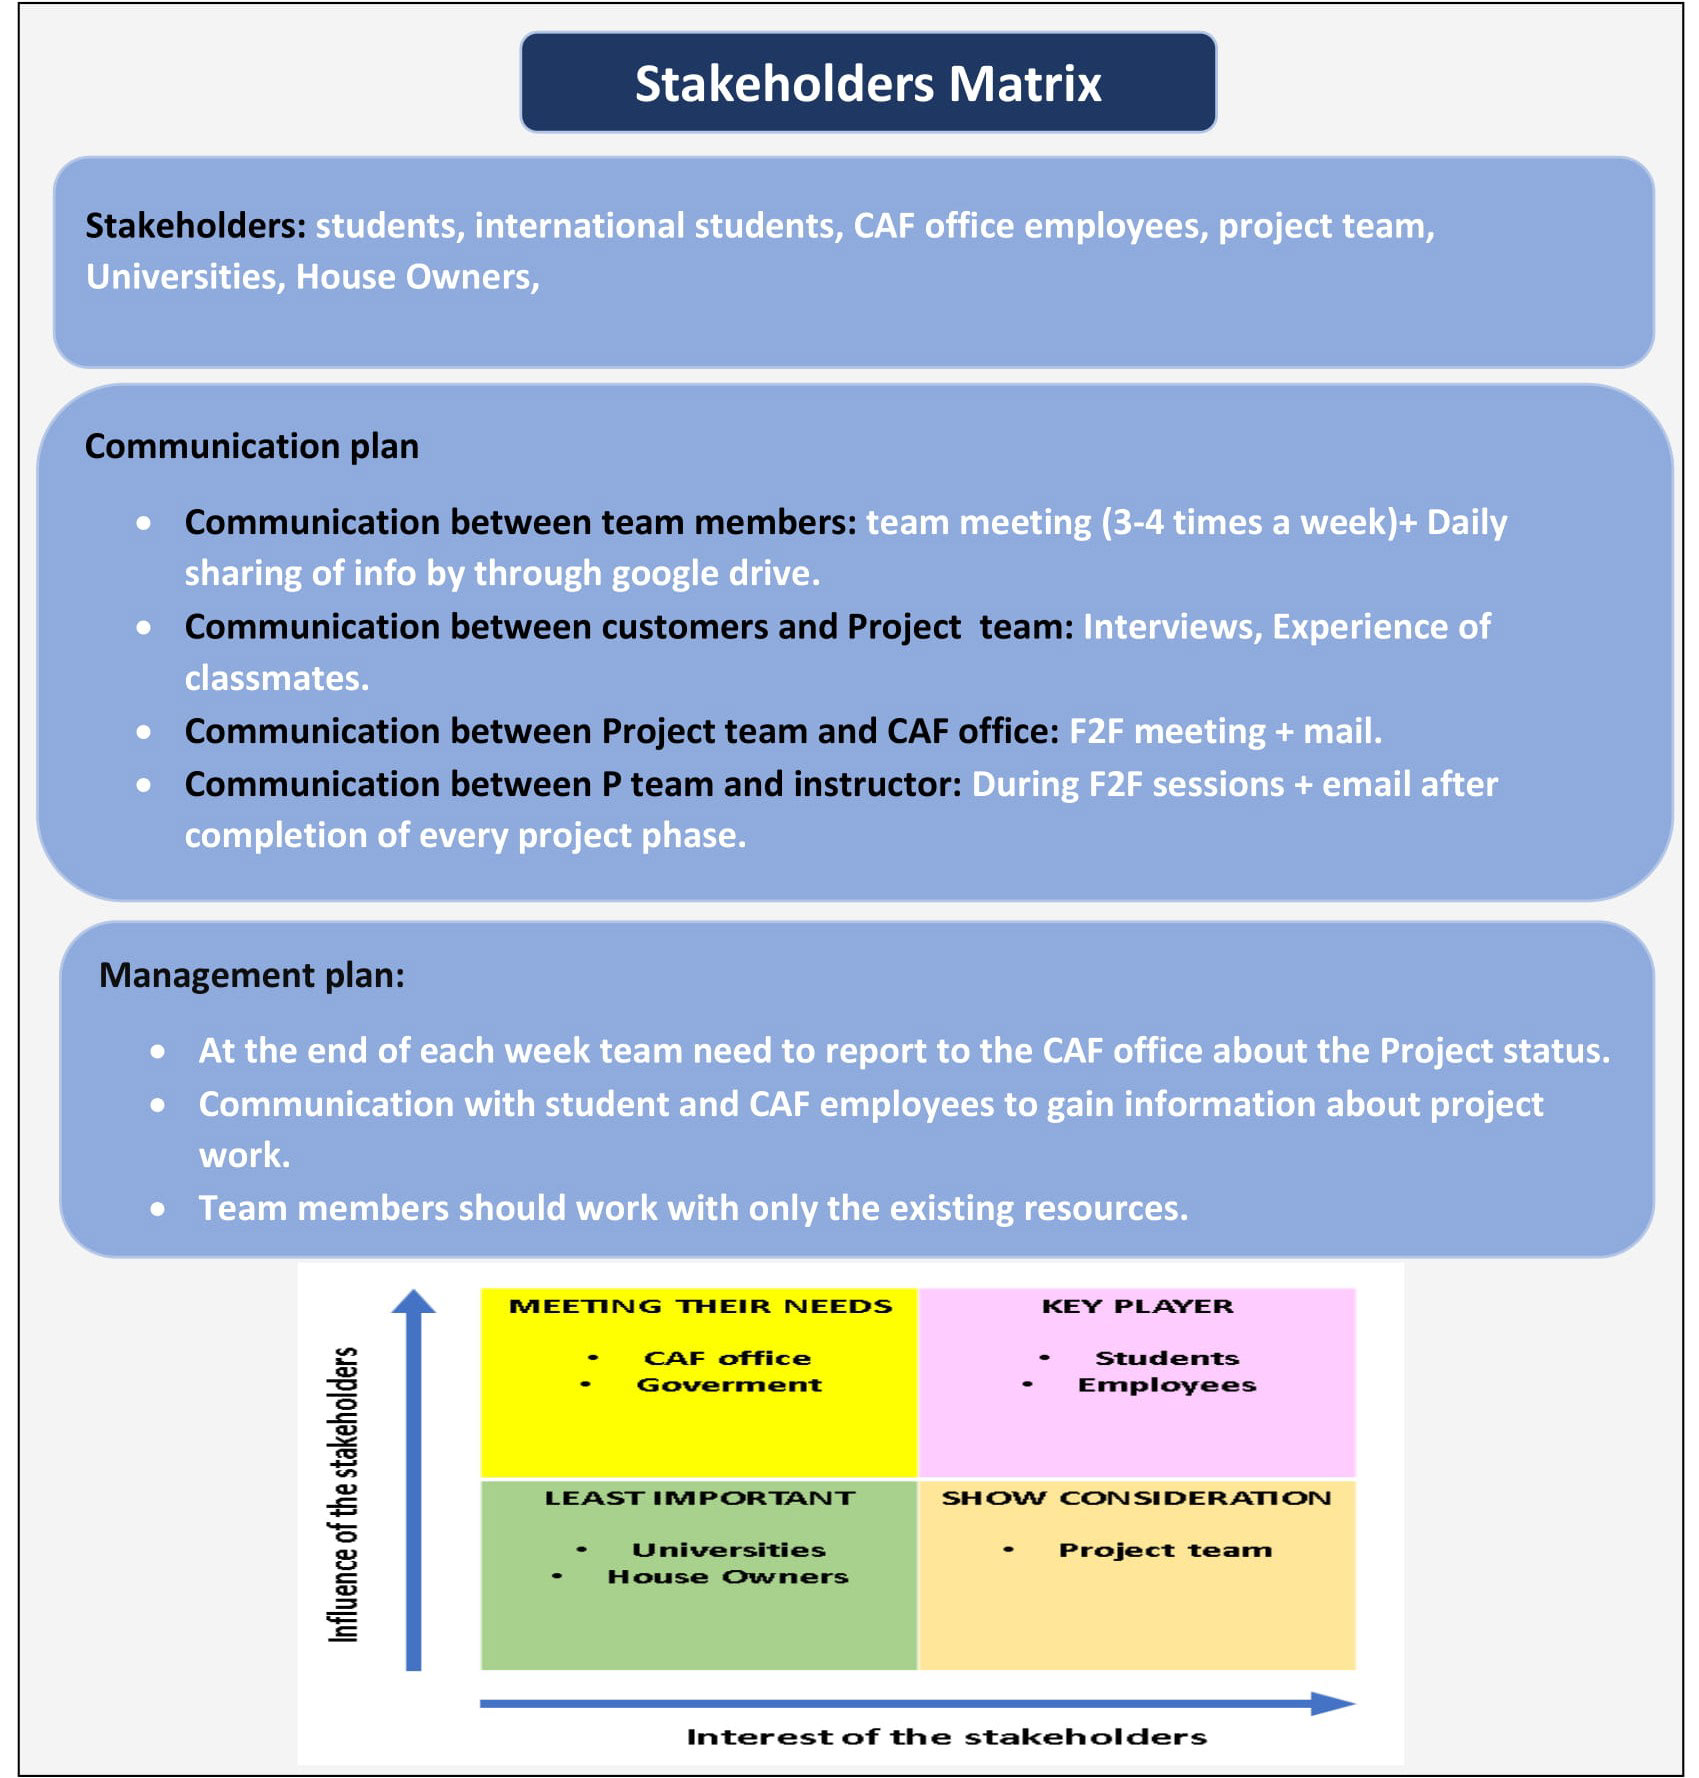
STAKEHOLDER MATRIX
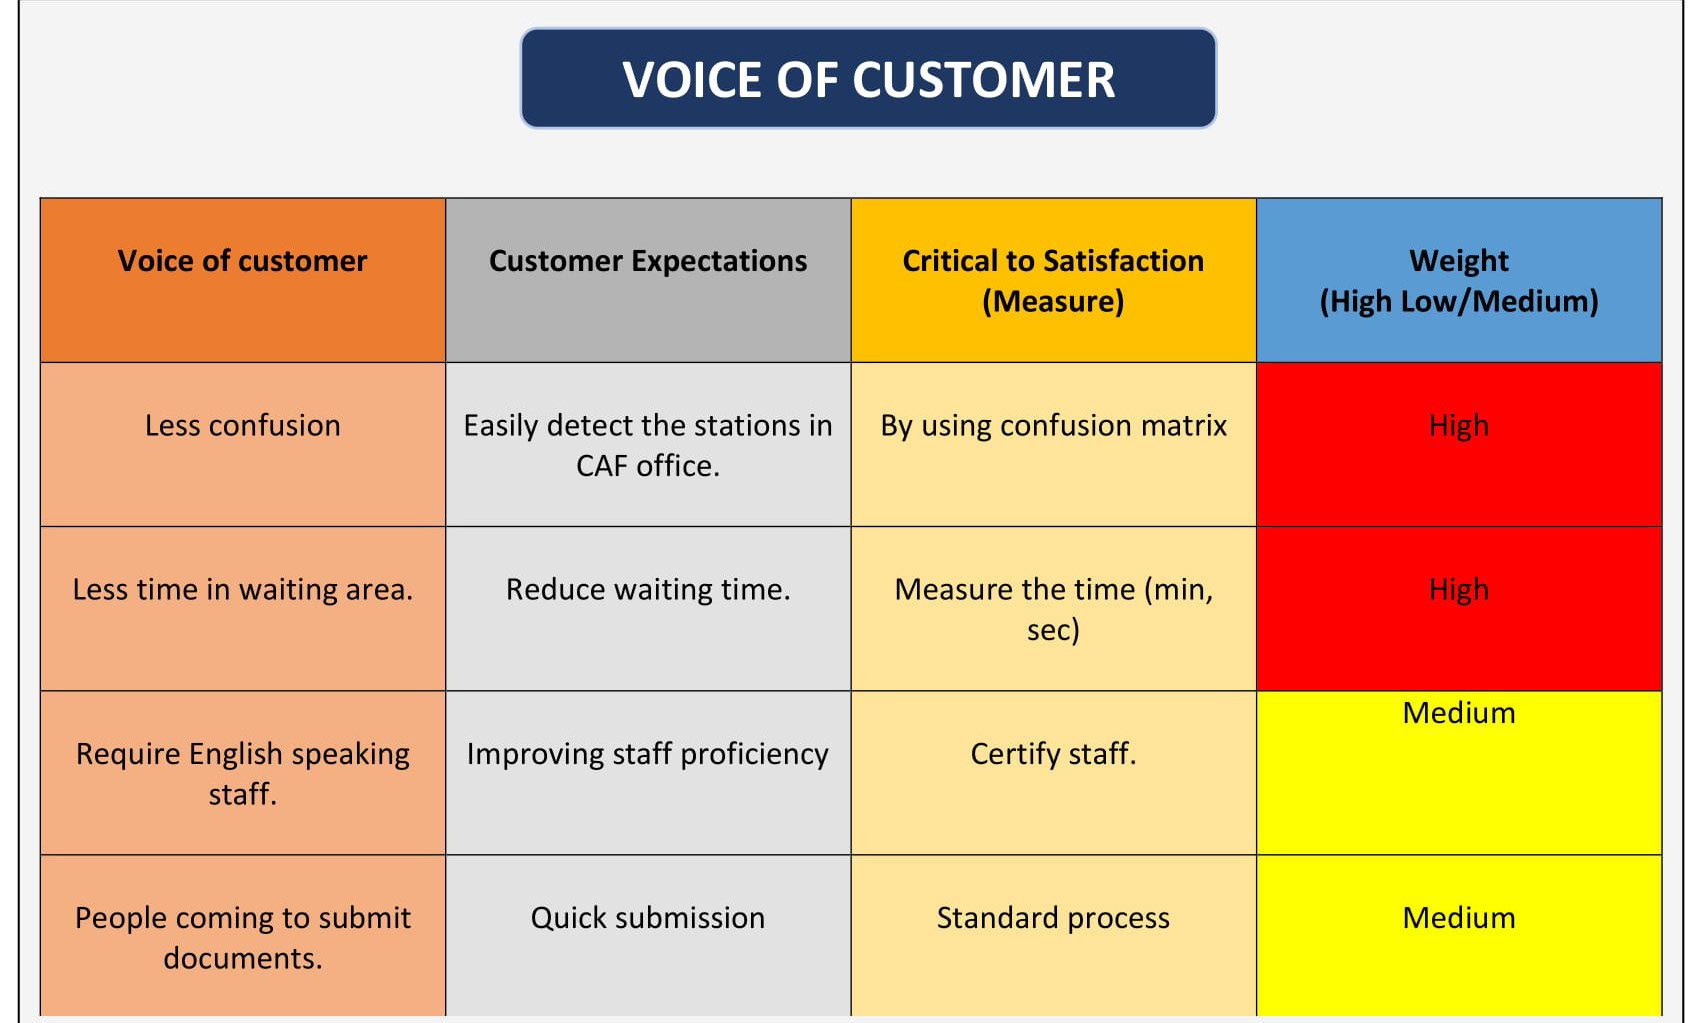
VOICE TO CUSTOMER
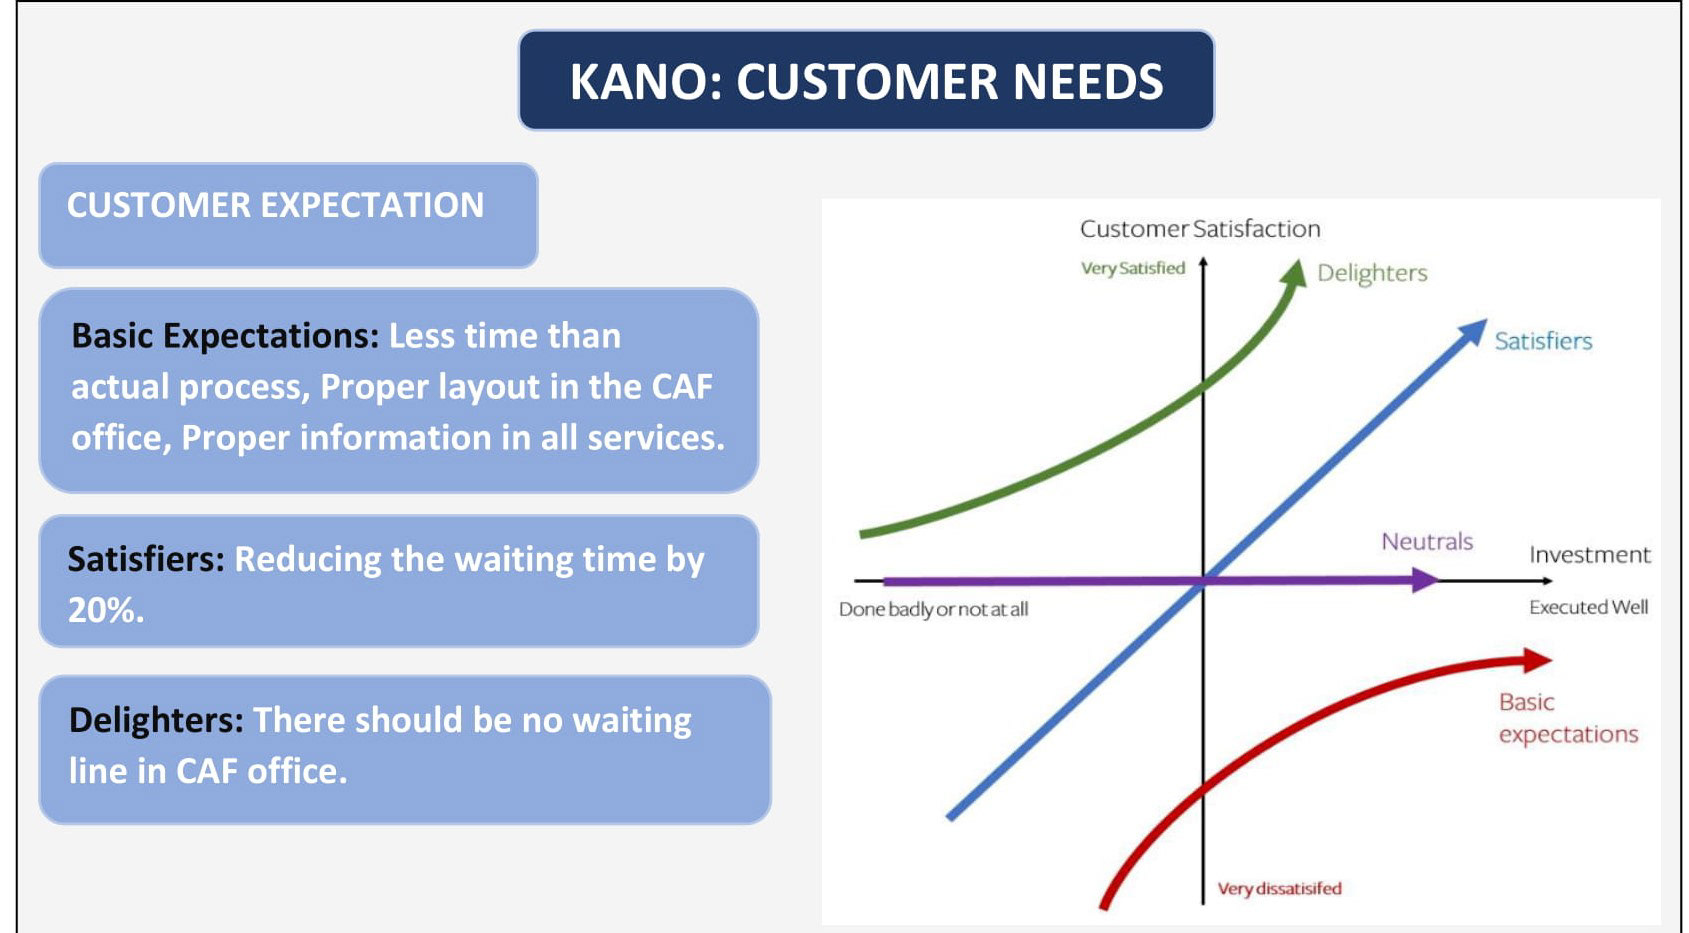
KANO MODEL FOR CUSTOMER NEEDS
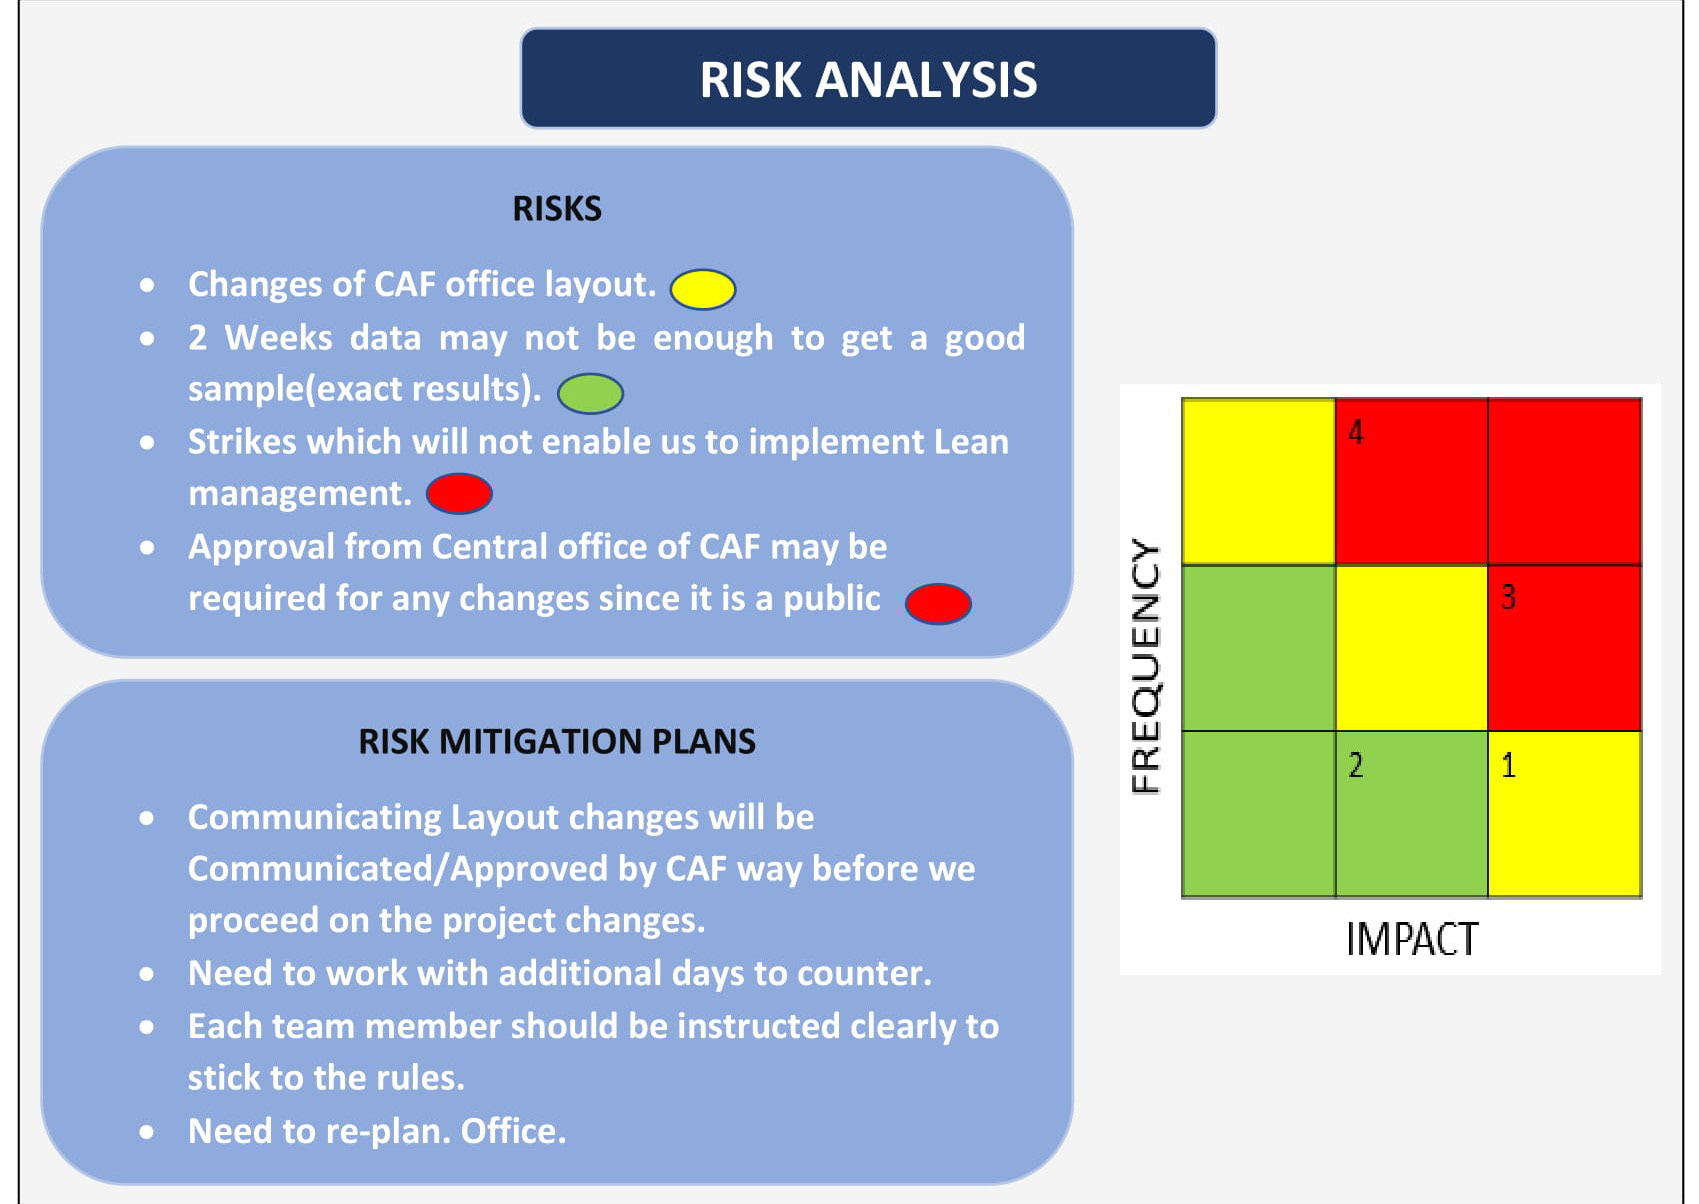
RISK ANALYSIS
MEASURE PHASE
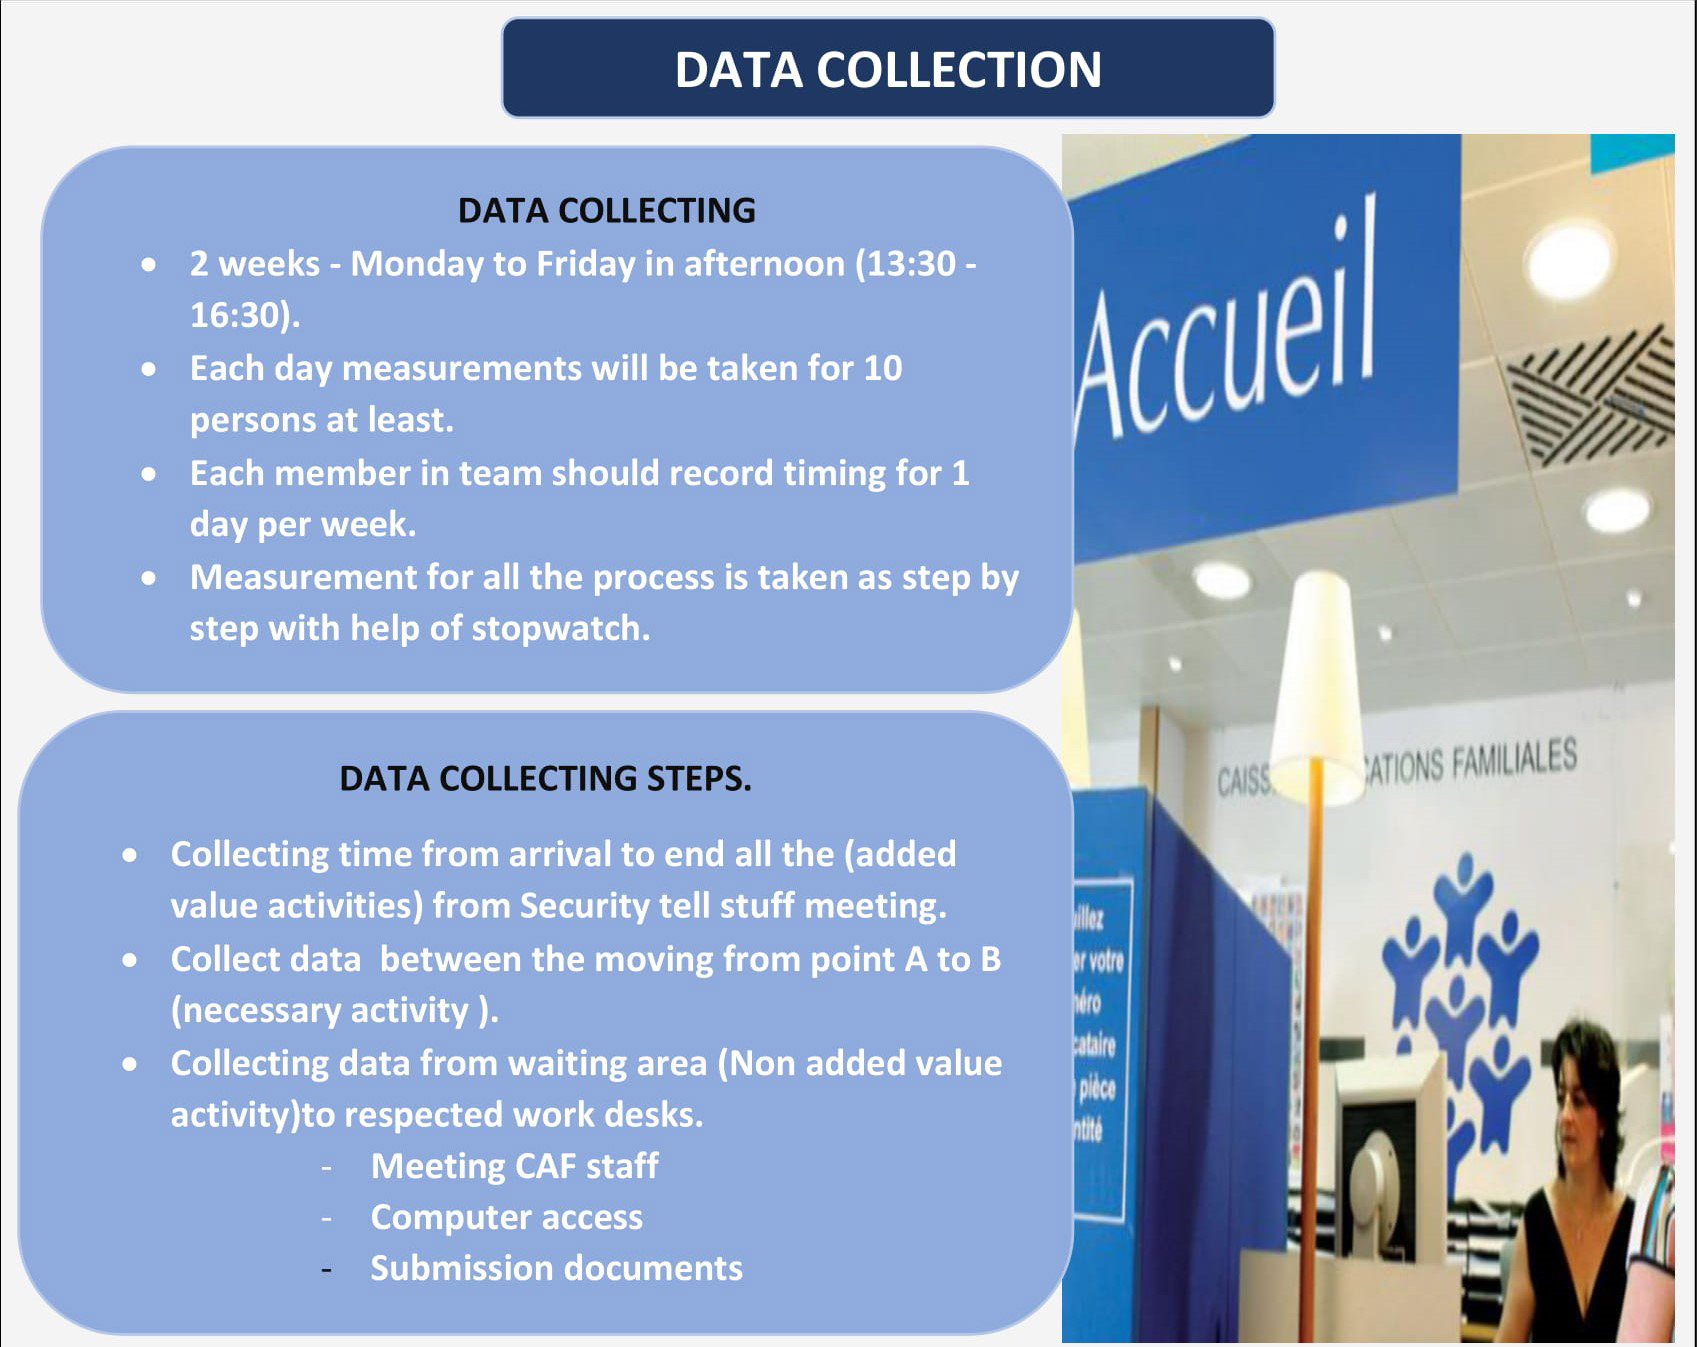
COLLECTION OF DATA
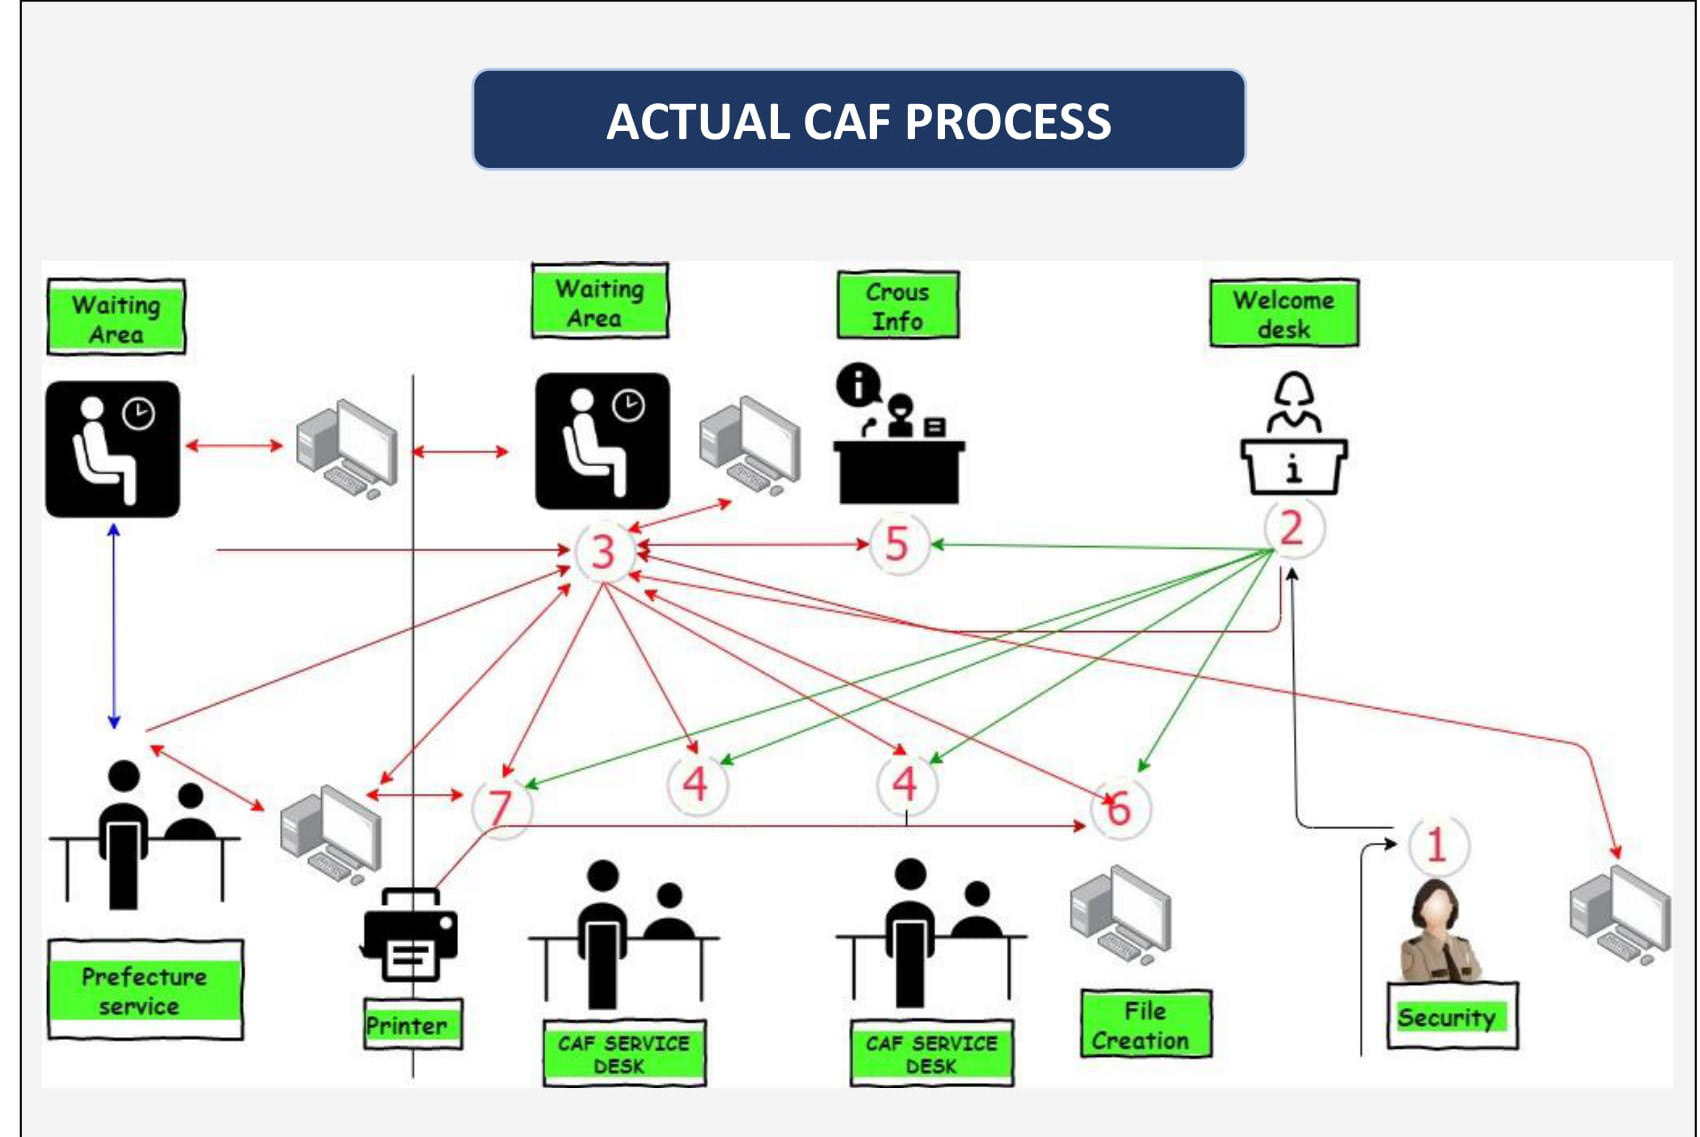
ACTUAL CAF PROCESS
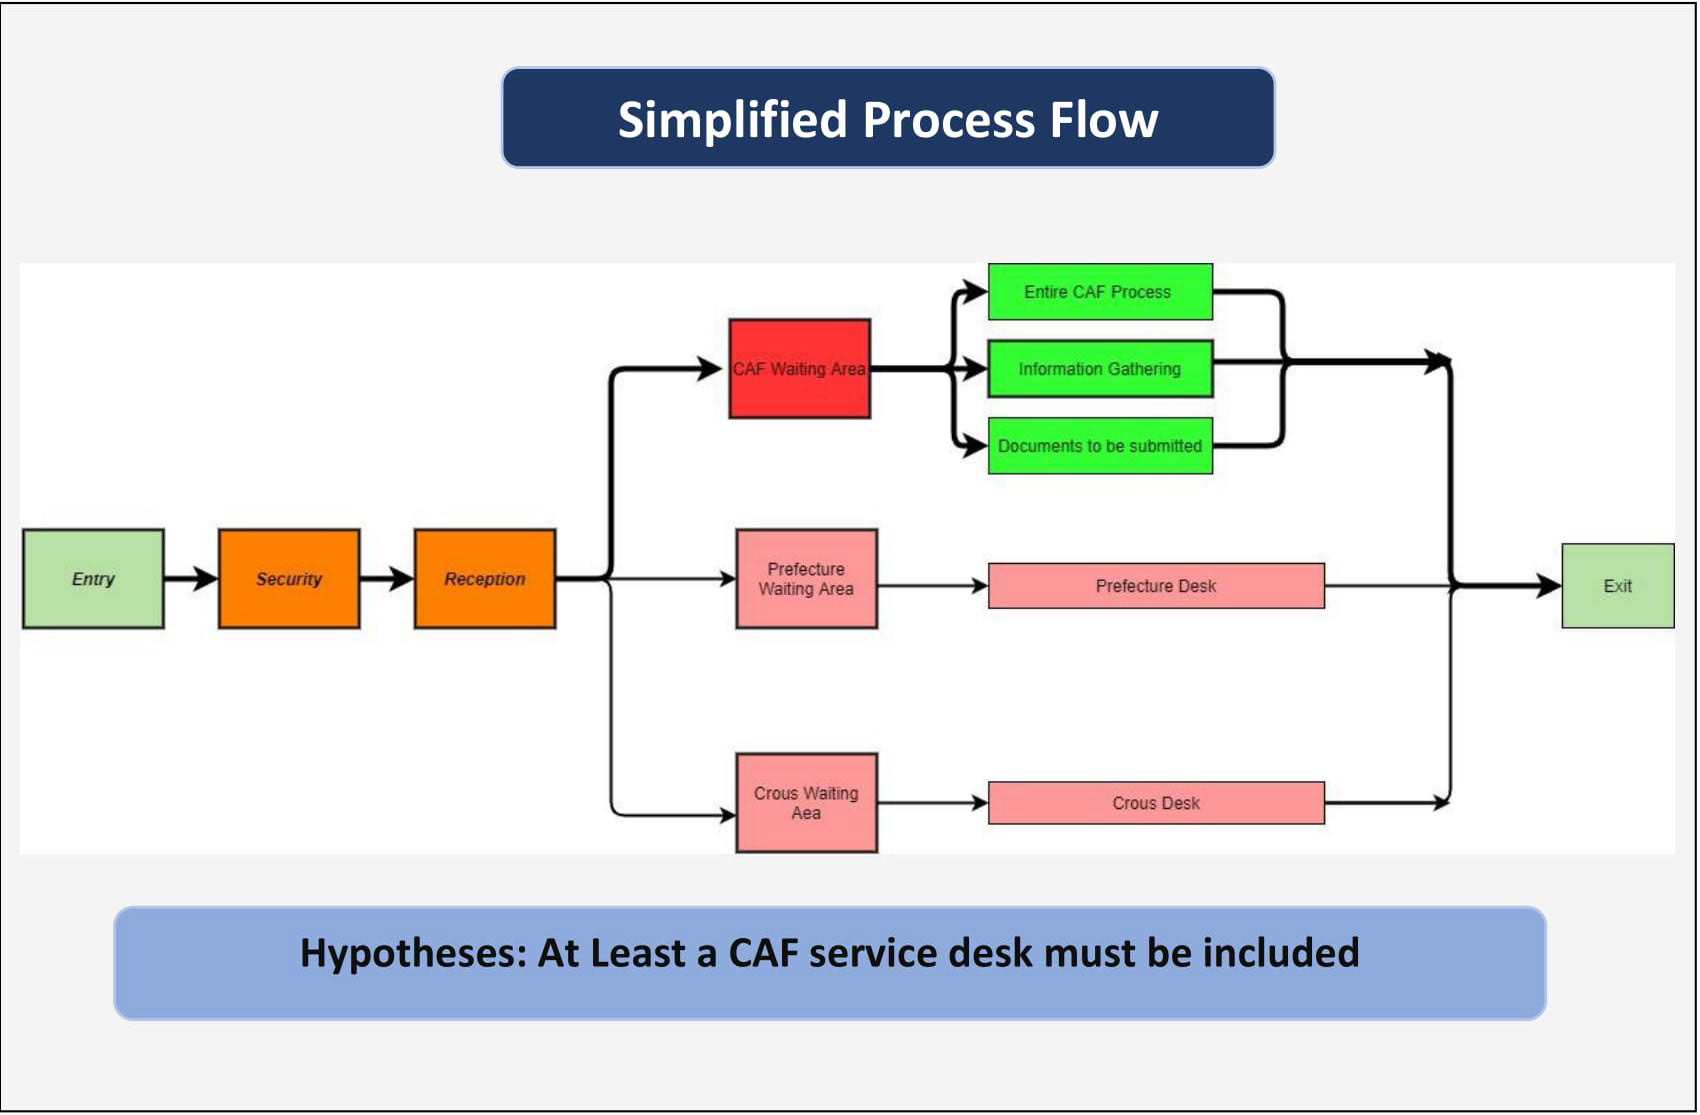
SIMPLIFIED PROCESS VIES
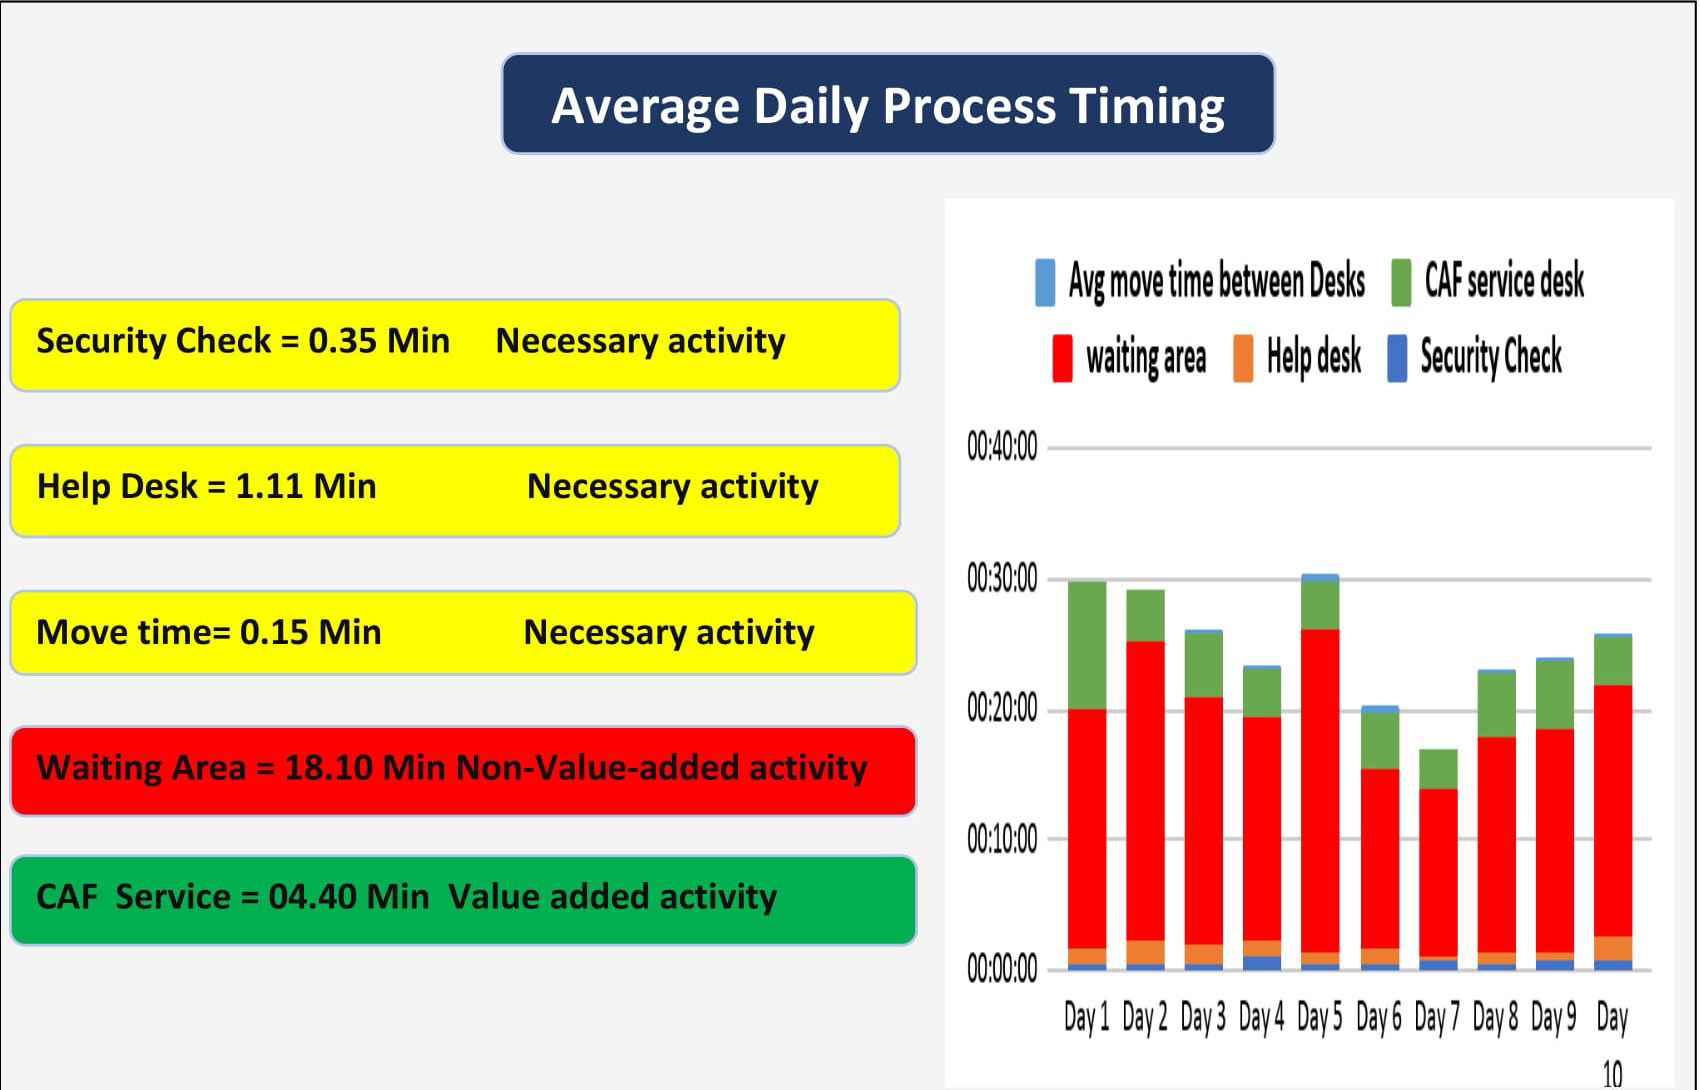
AVERAGE DAILY PROCESS TIMING
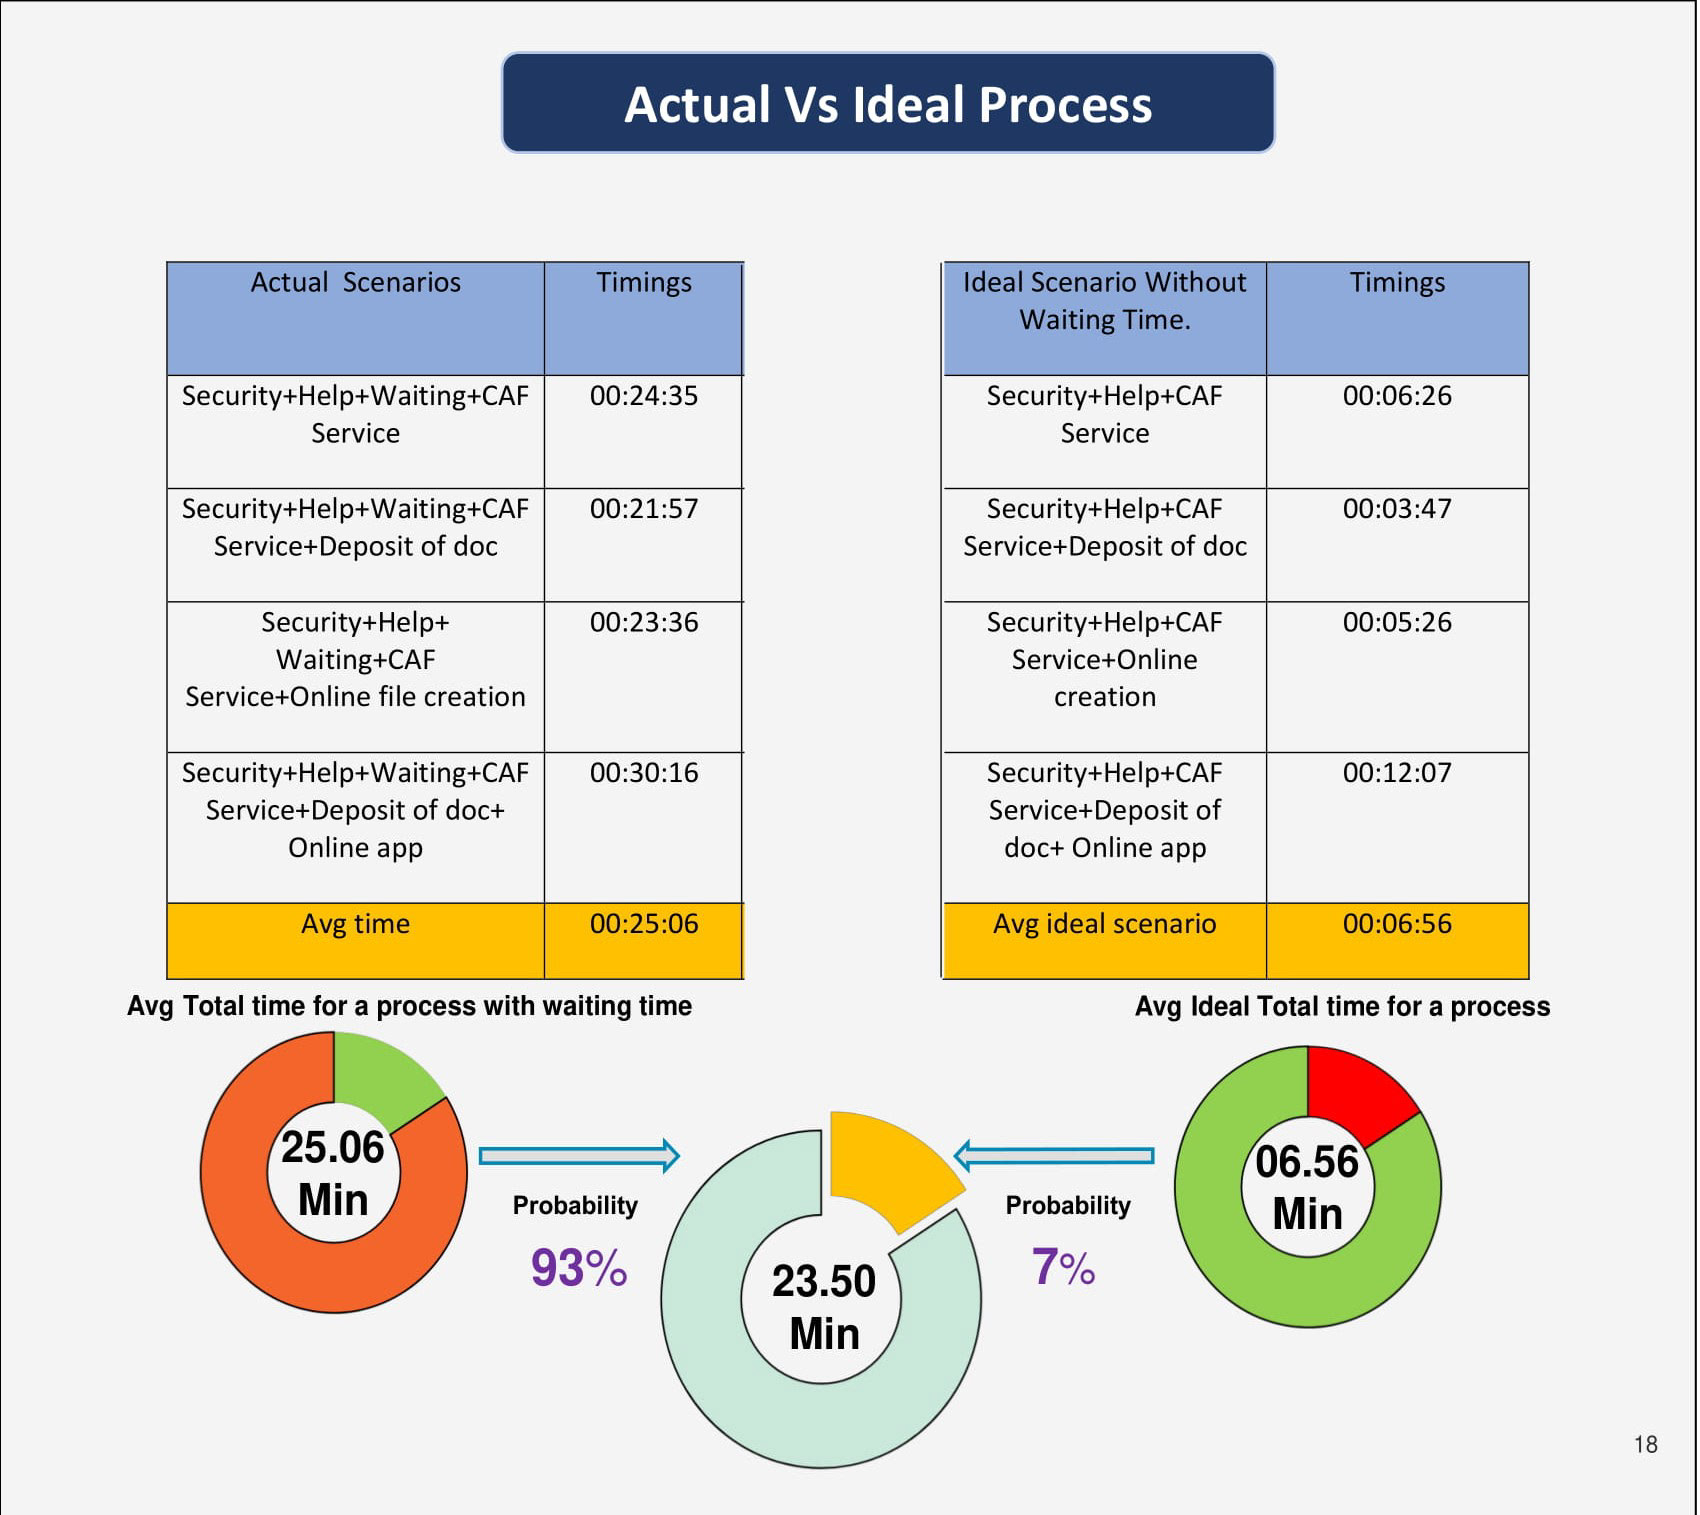
ACTUAL VS IDEAL PROCESS
Excel sheet below includes all our calculation work it will help you in understanding measure phase of our project
ANALYSIS PHASE
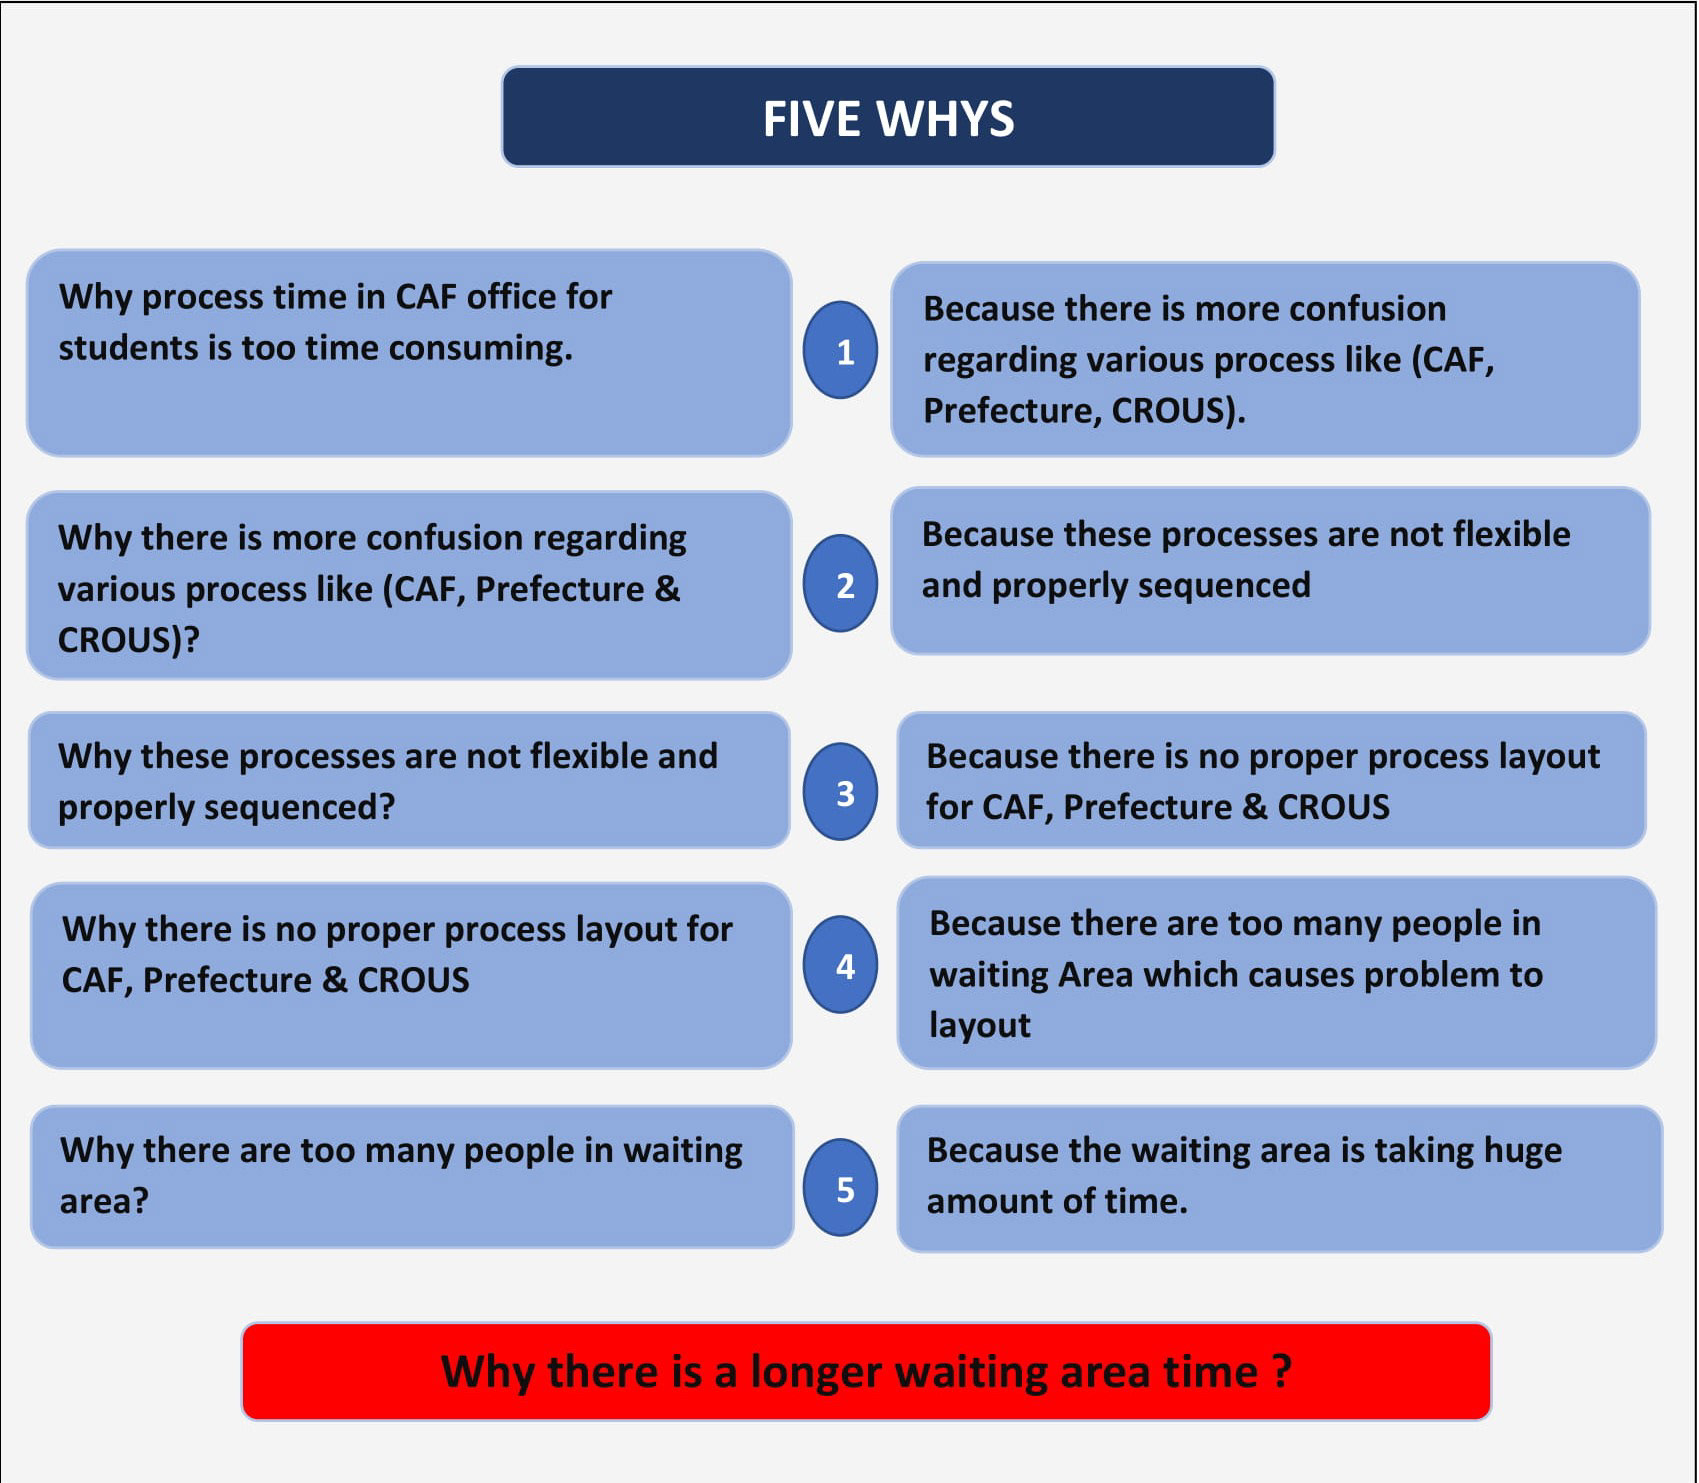
FIVE WHY
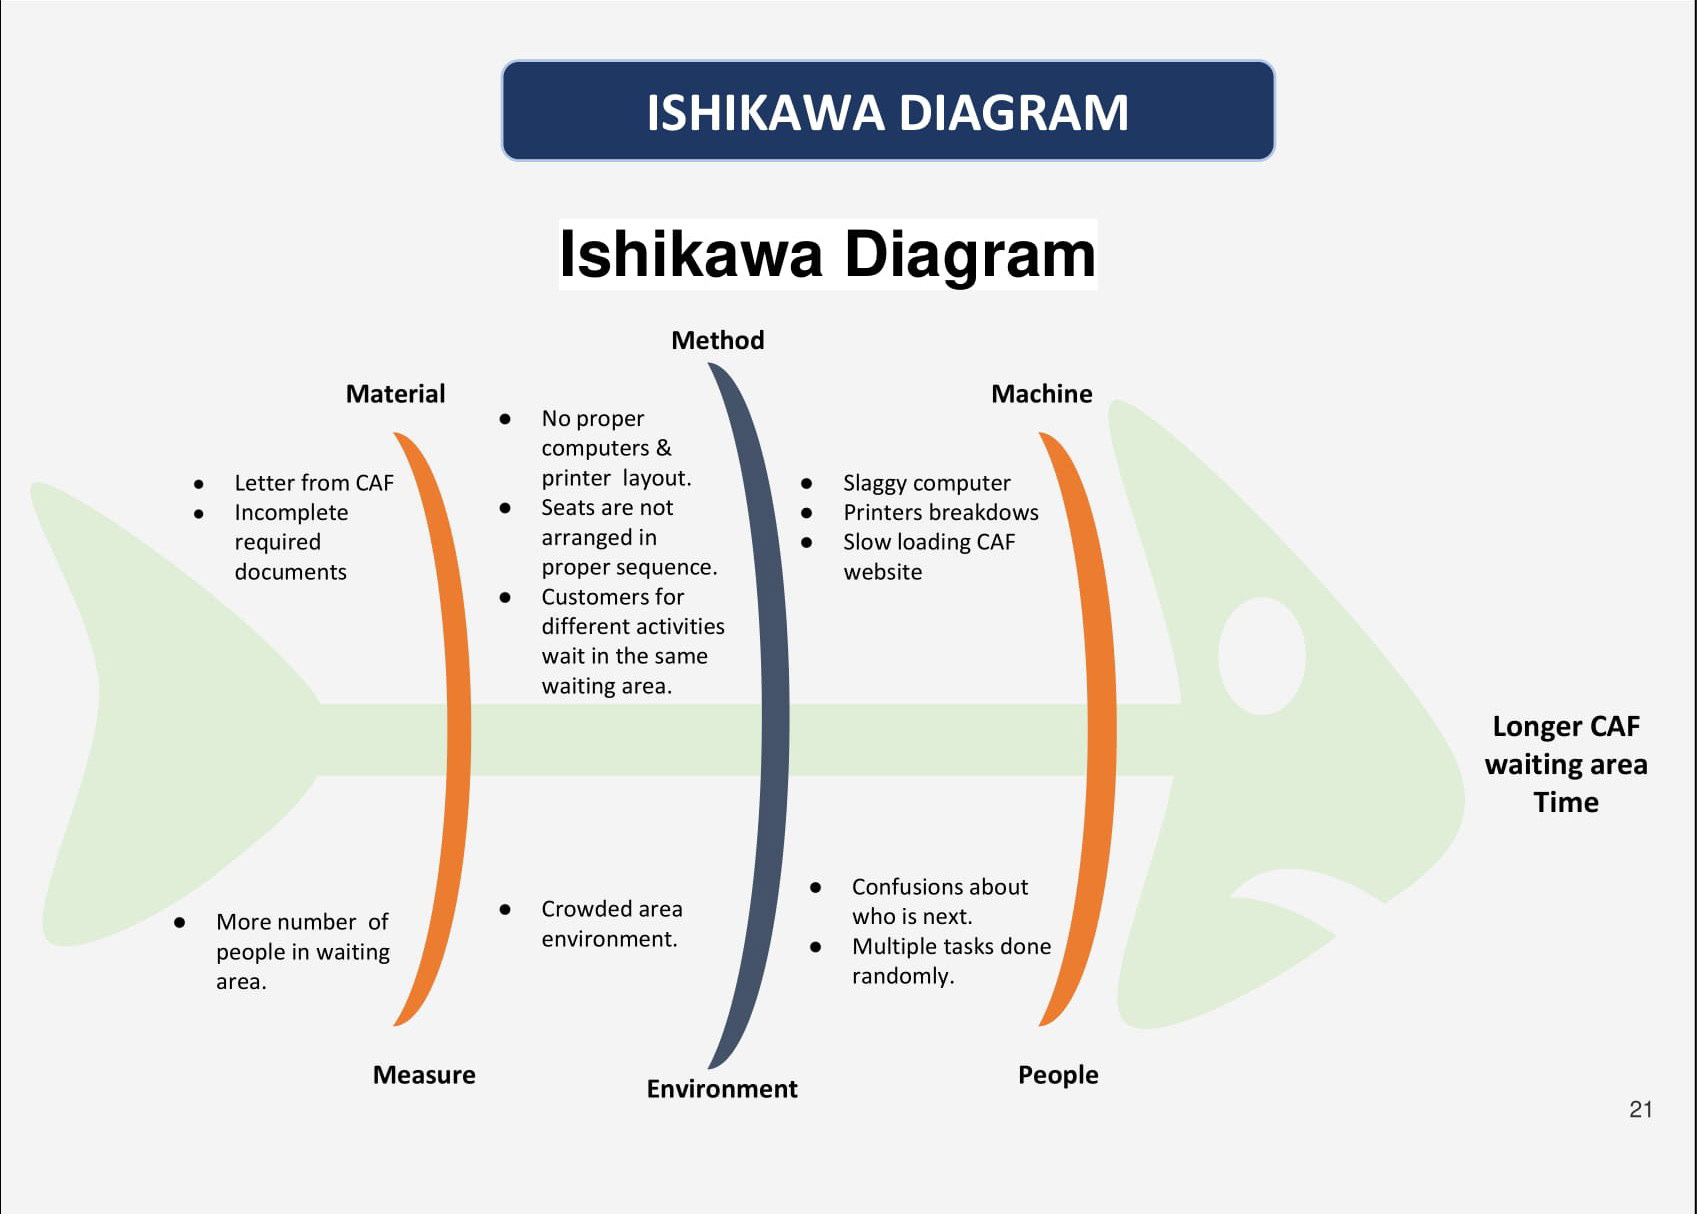
ISHIKAWA DIAGRAM
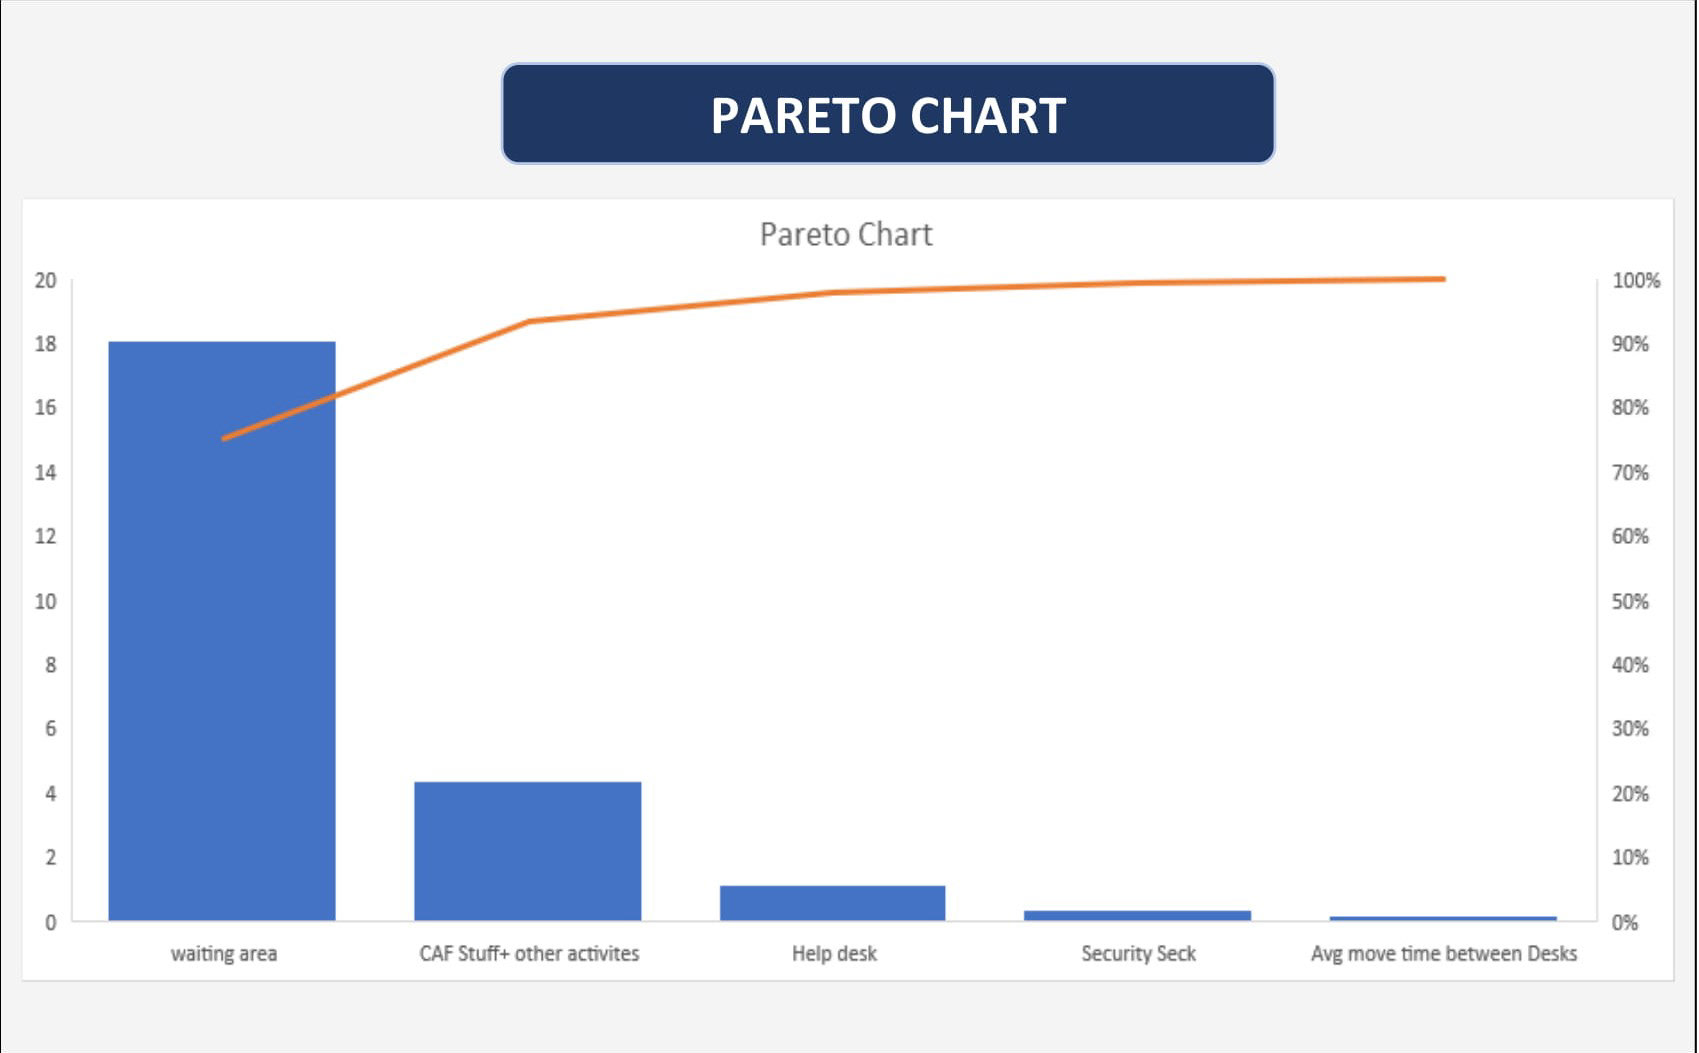
PARETO CHART
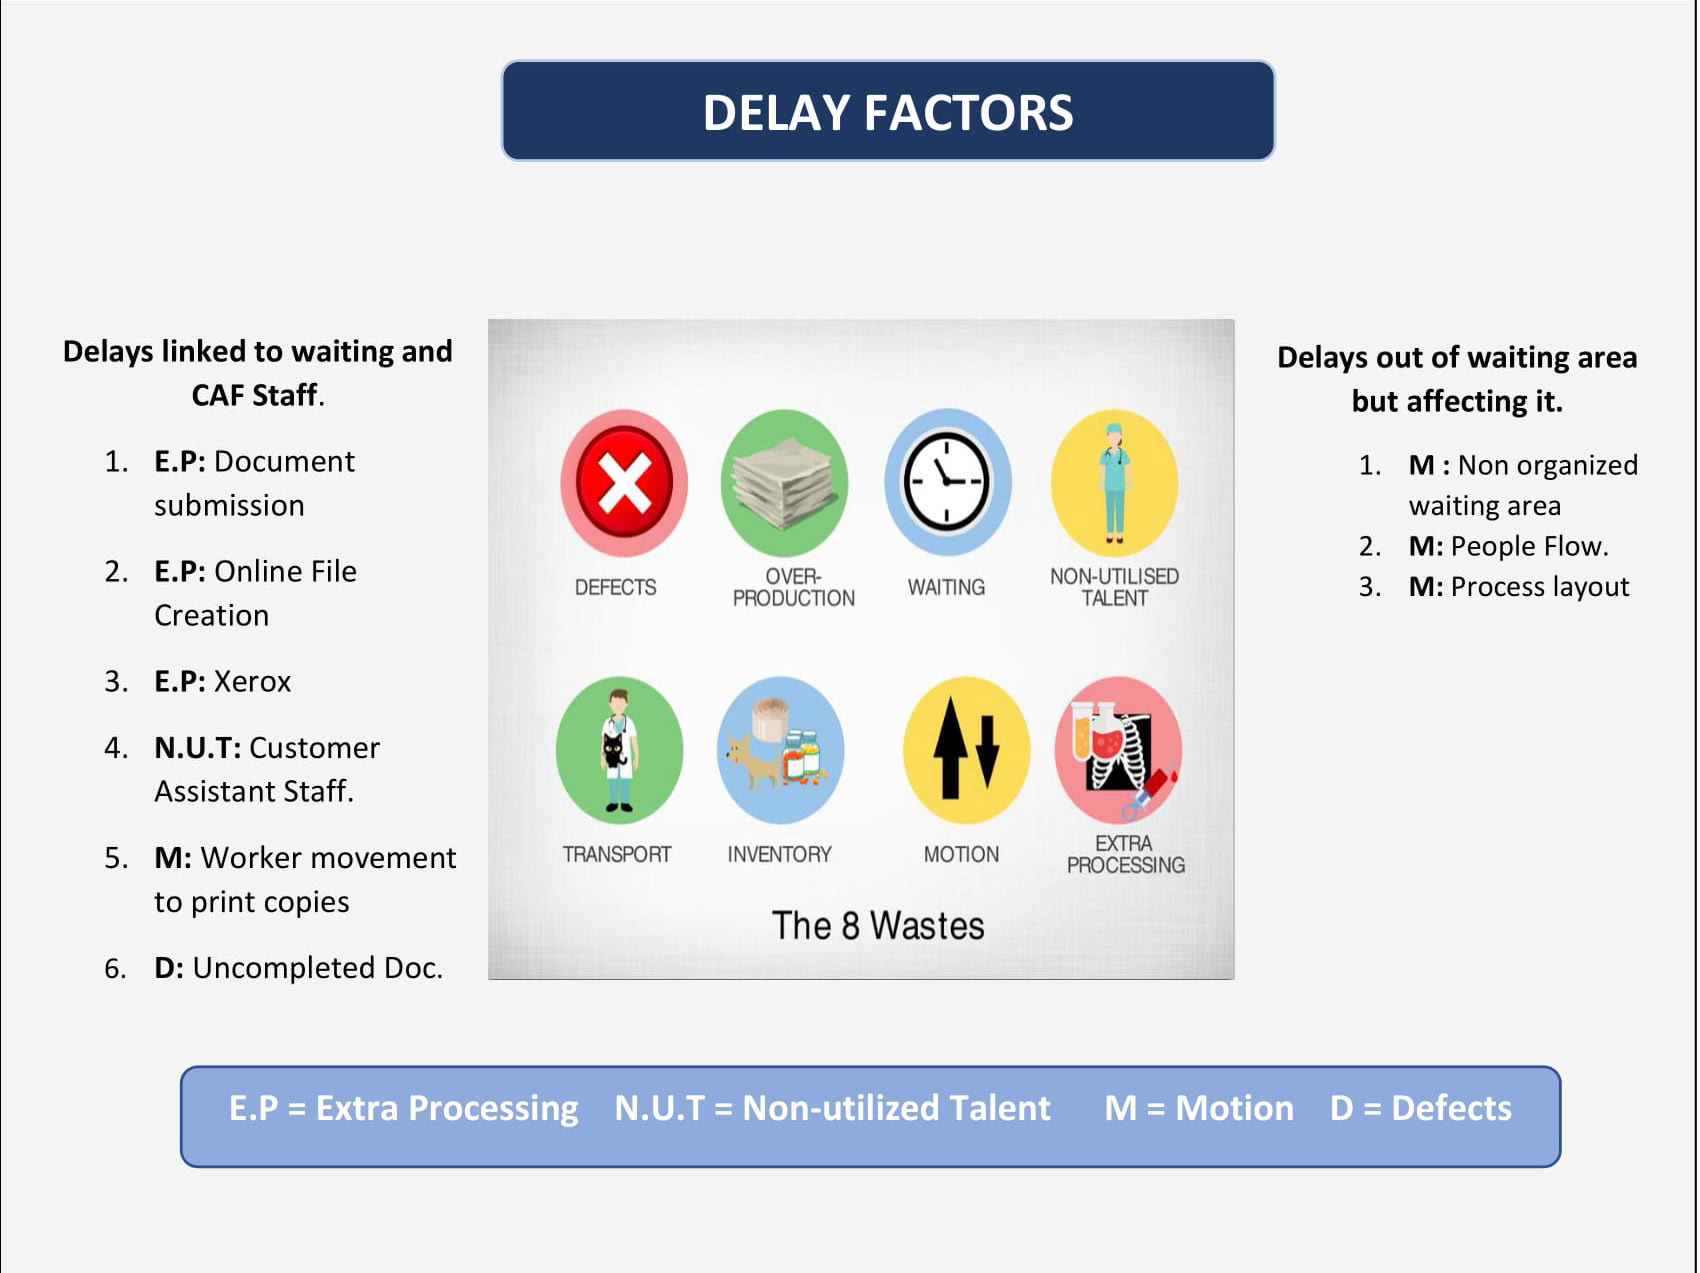
DELAY FACTOR
Failure mode and effects analysis (FMEA)
Excel sheet below help you to understand potential failure of our project
IMPROVE PHASE
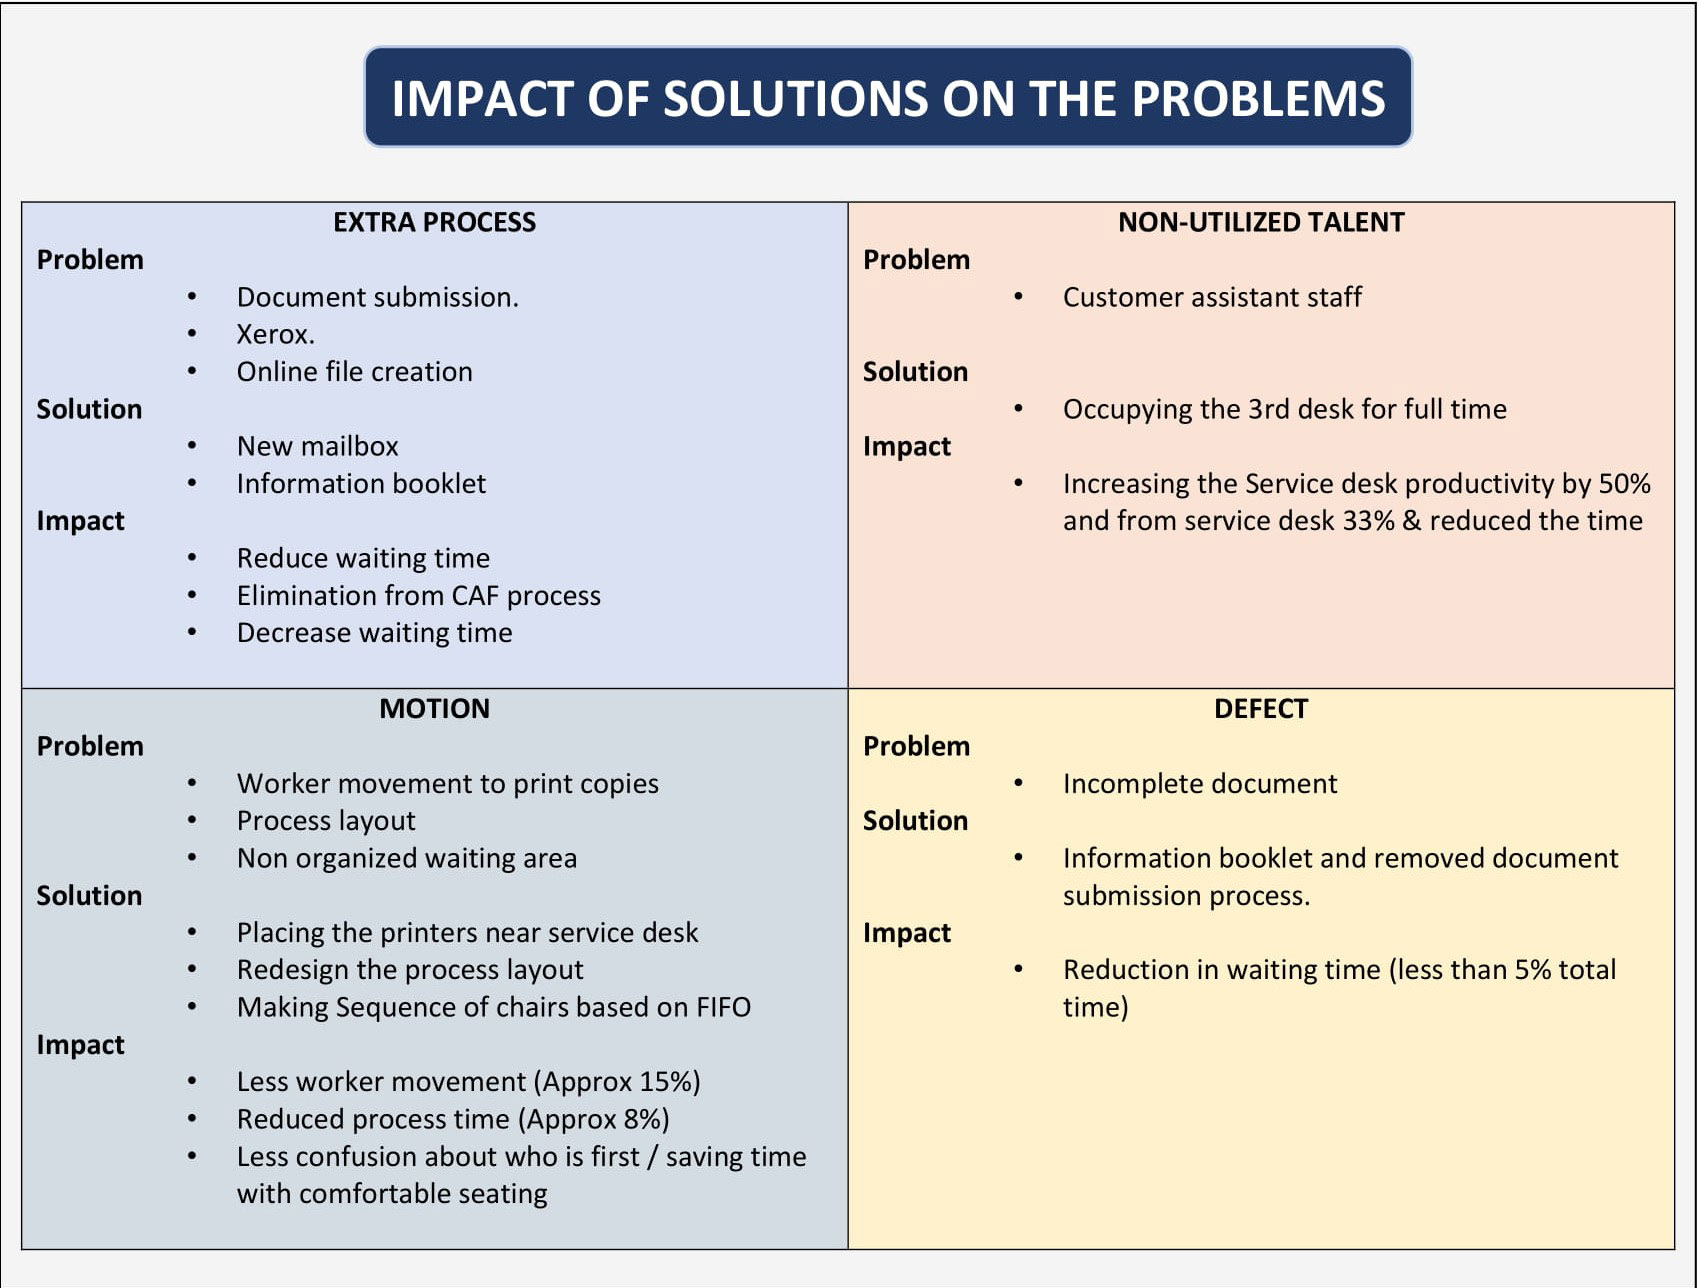
IMPACT OF SOLUTION ON THE PROBLEM
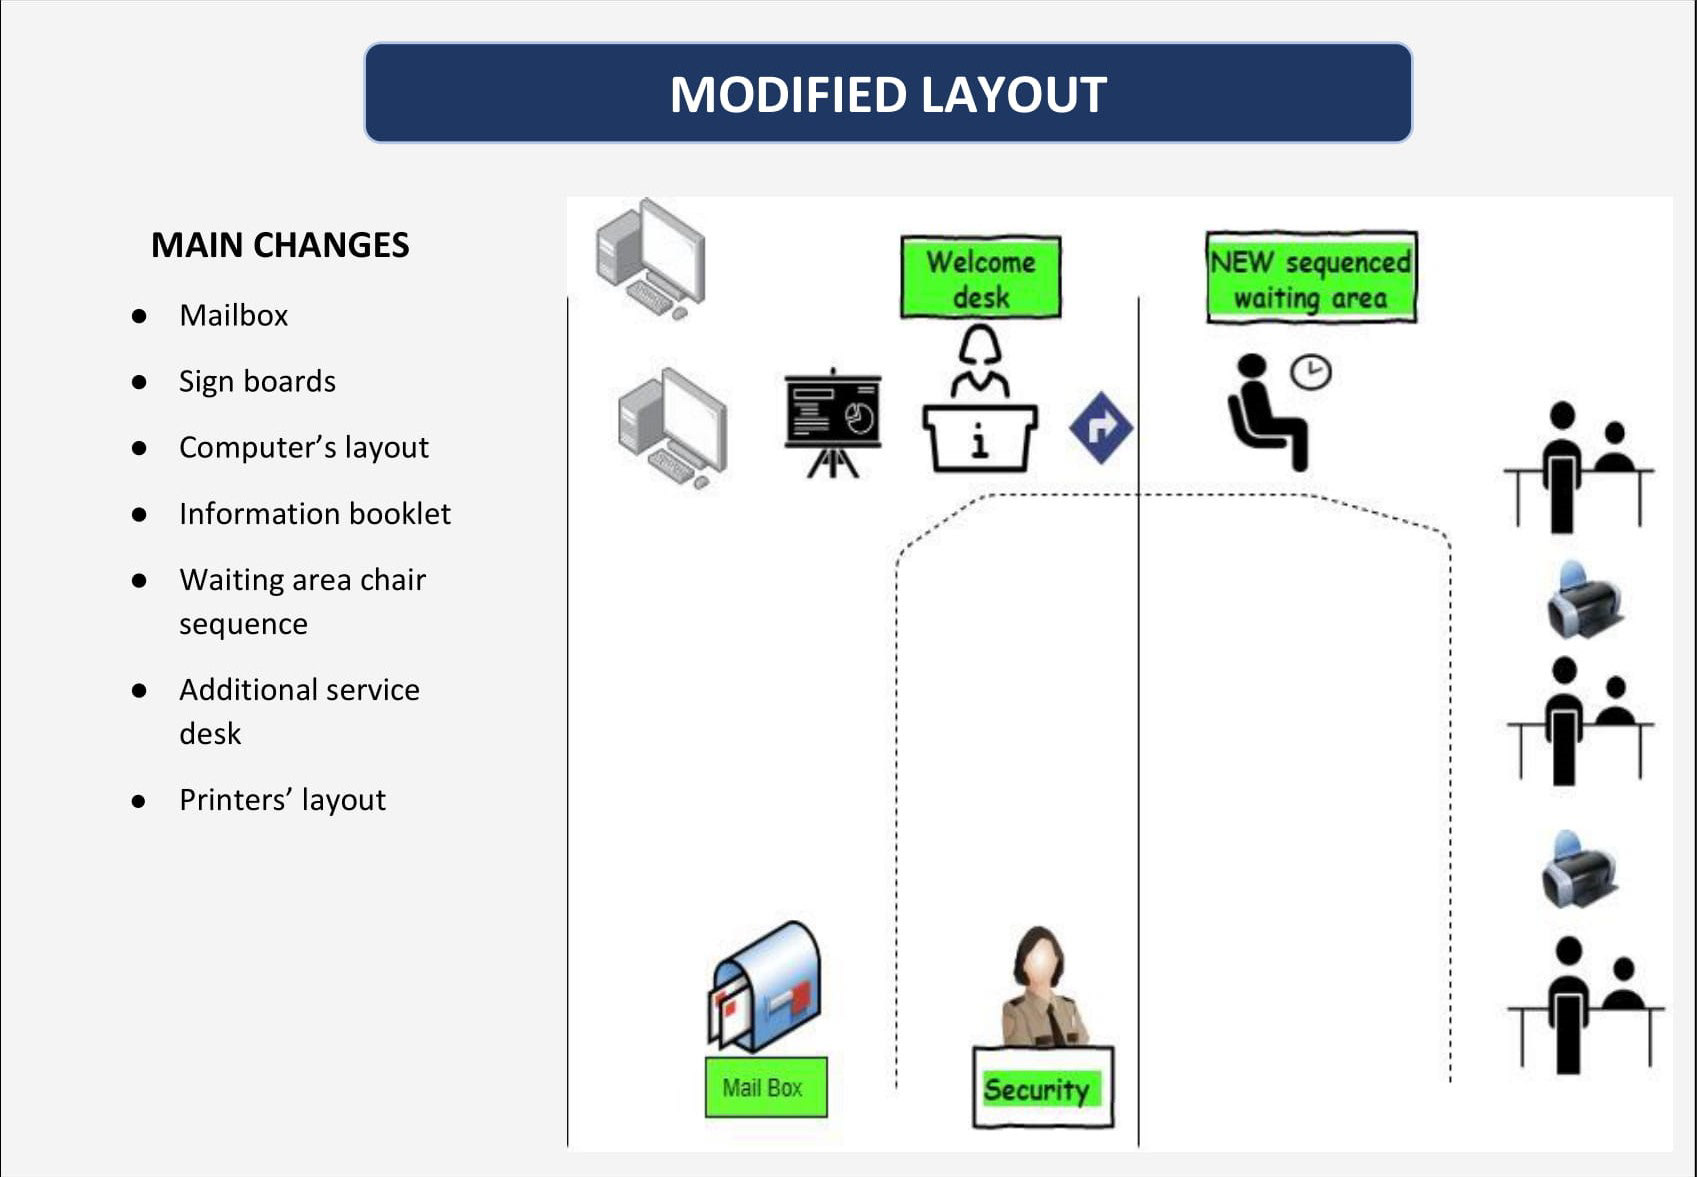
MODIFIED LAYOUT
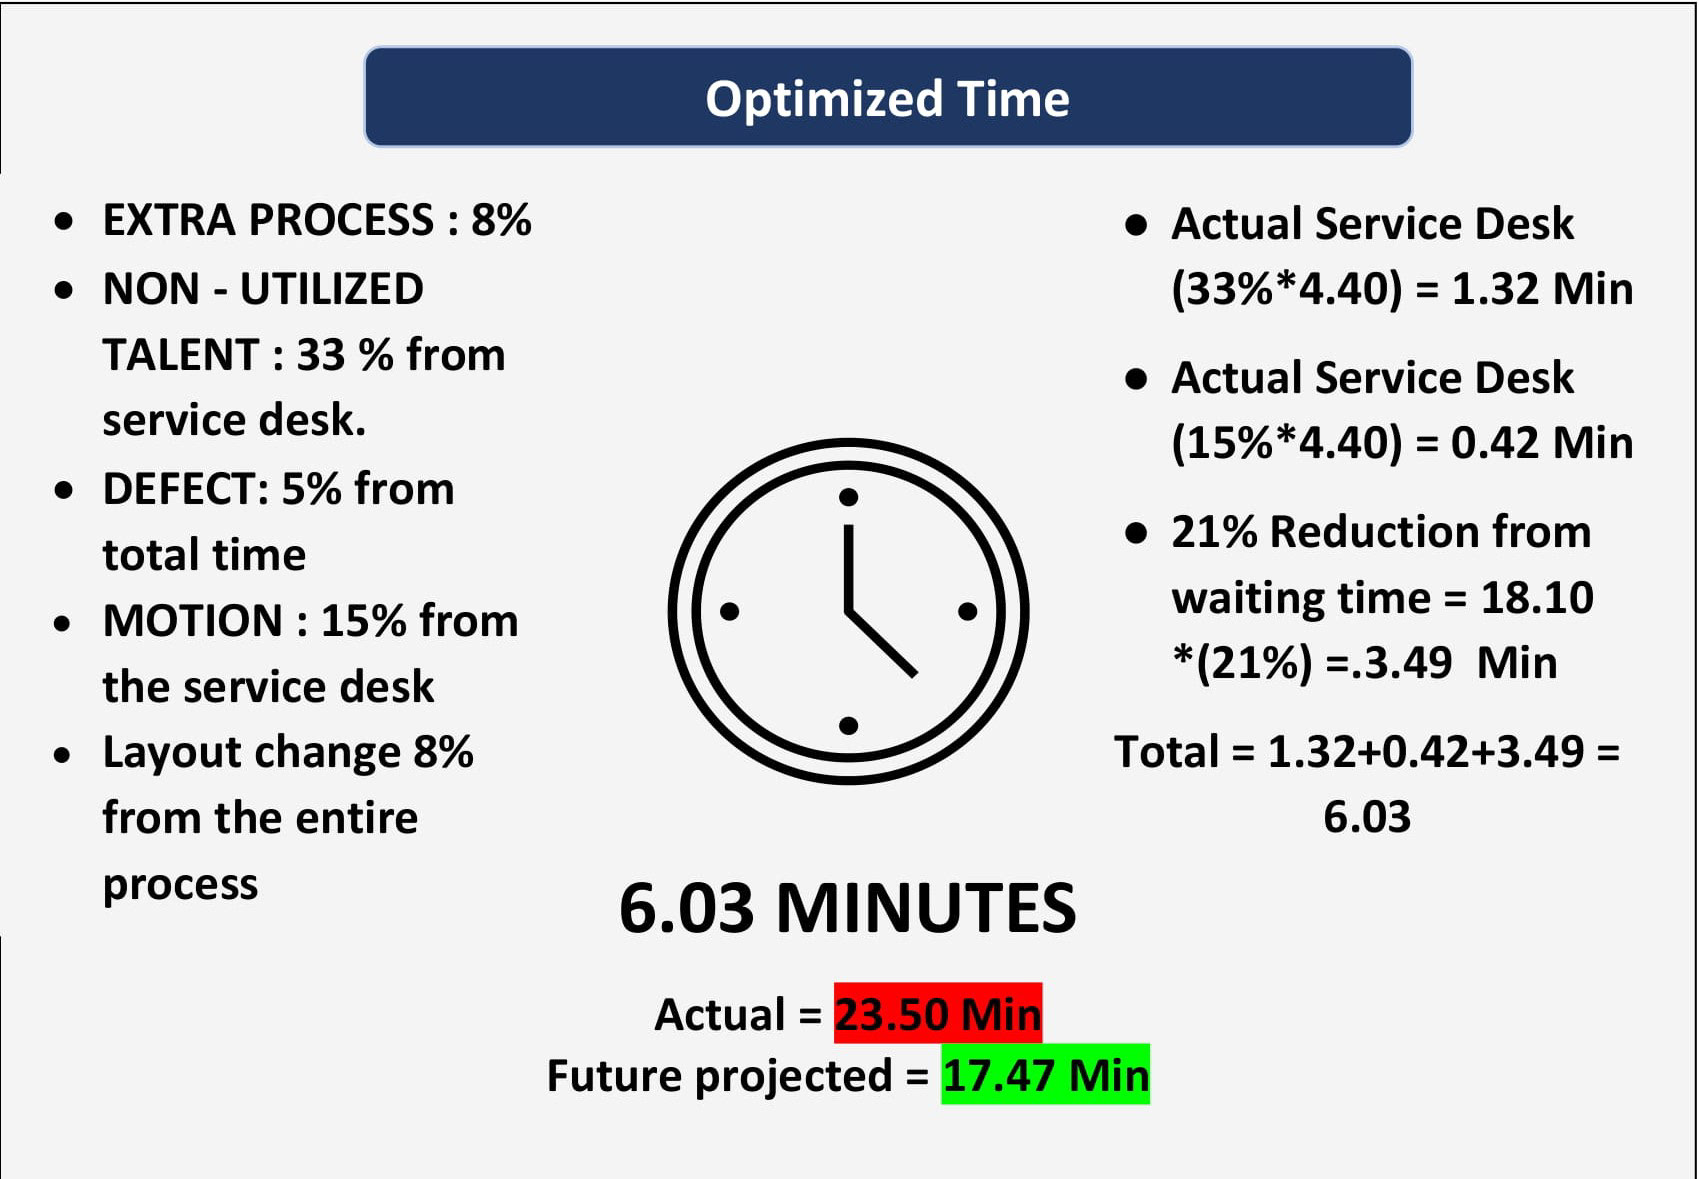
OPTIMIZED TIME
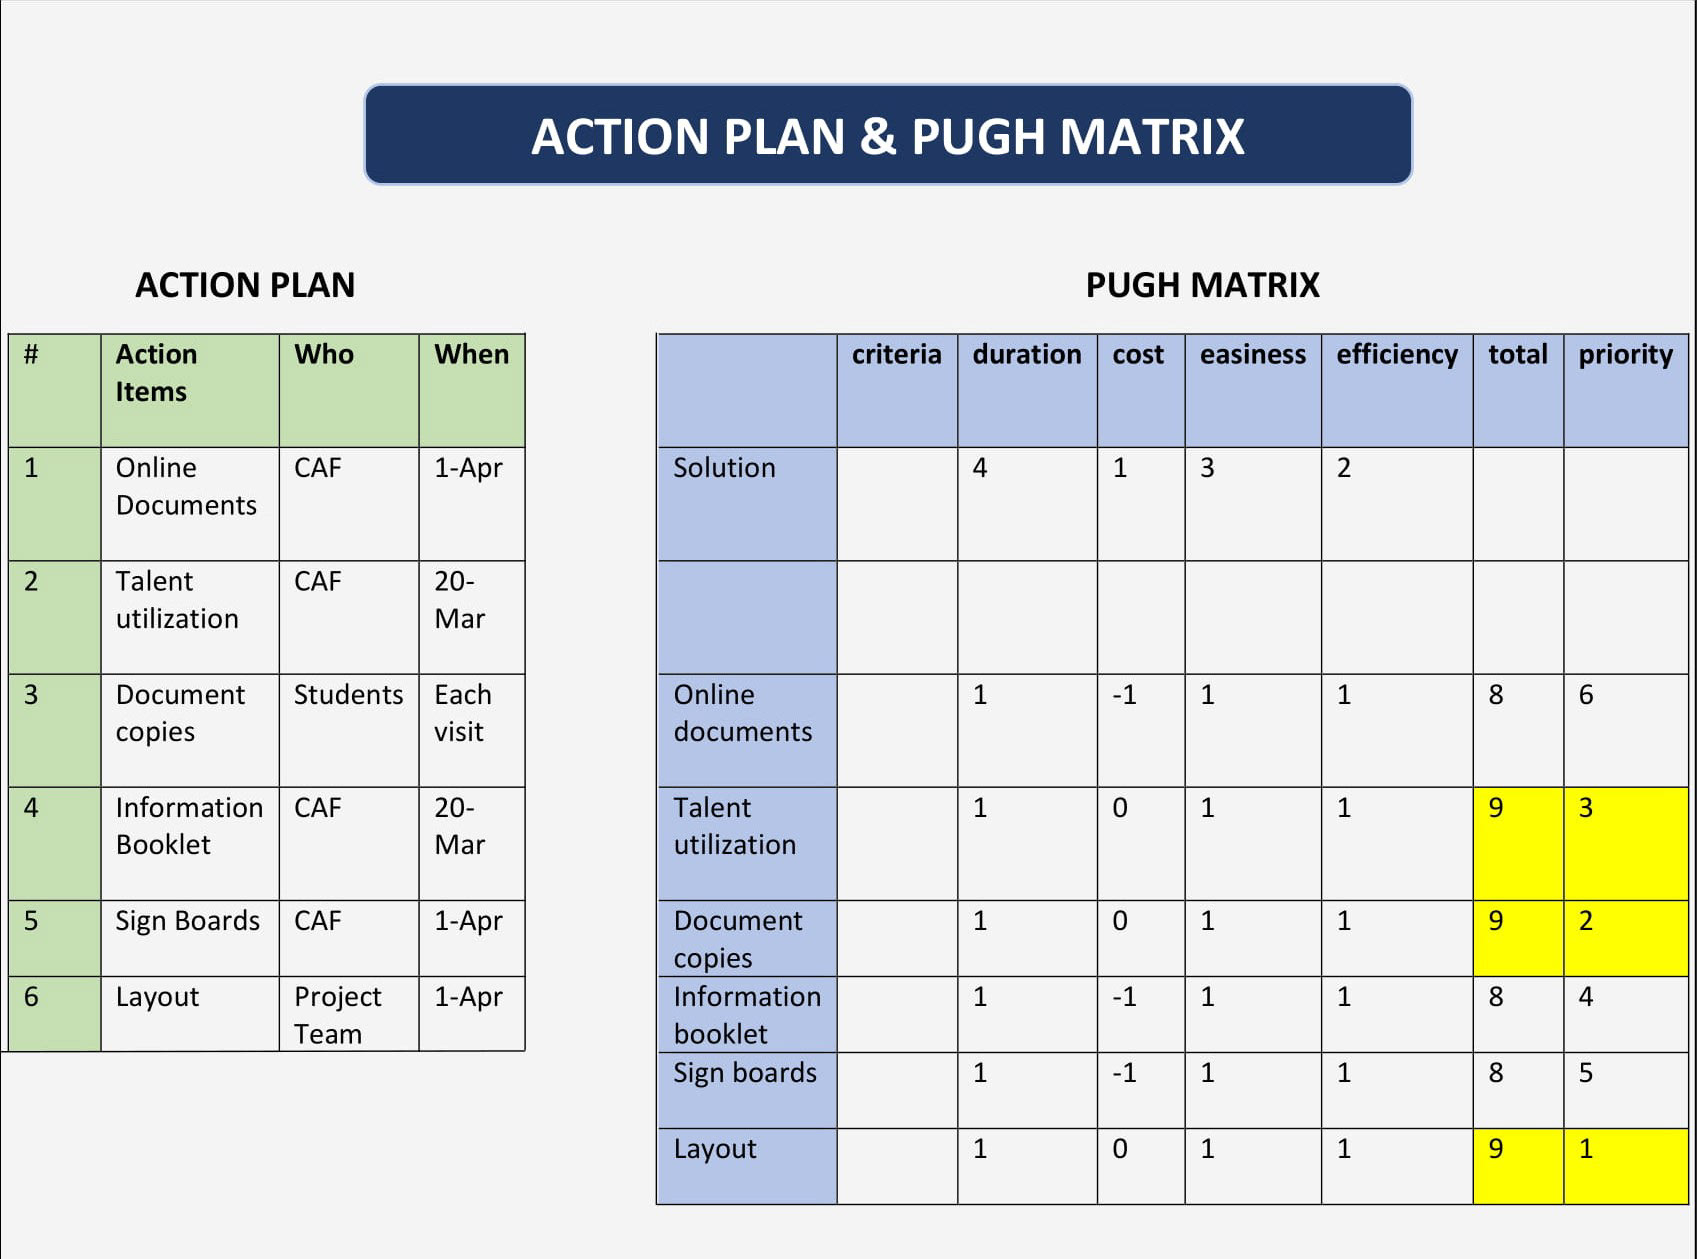
ACTION PLAN AND PLUG MATRIX
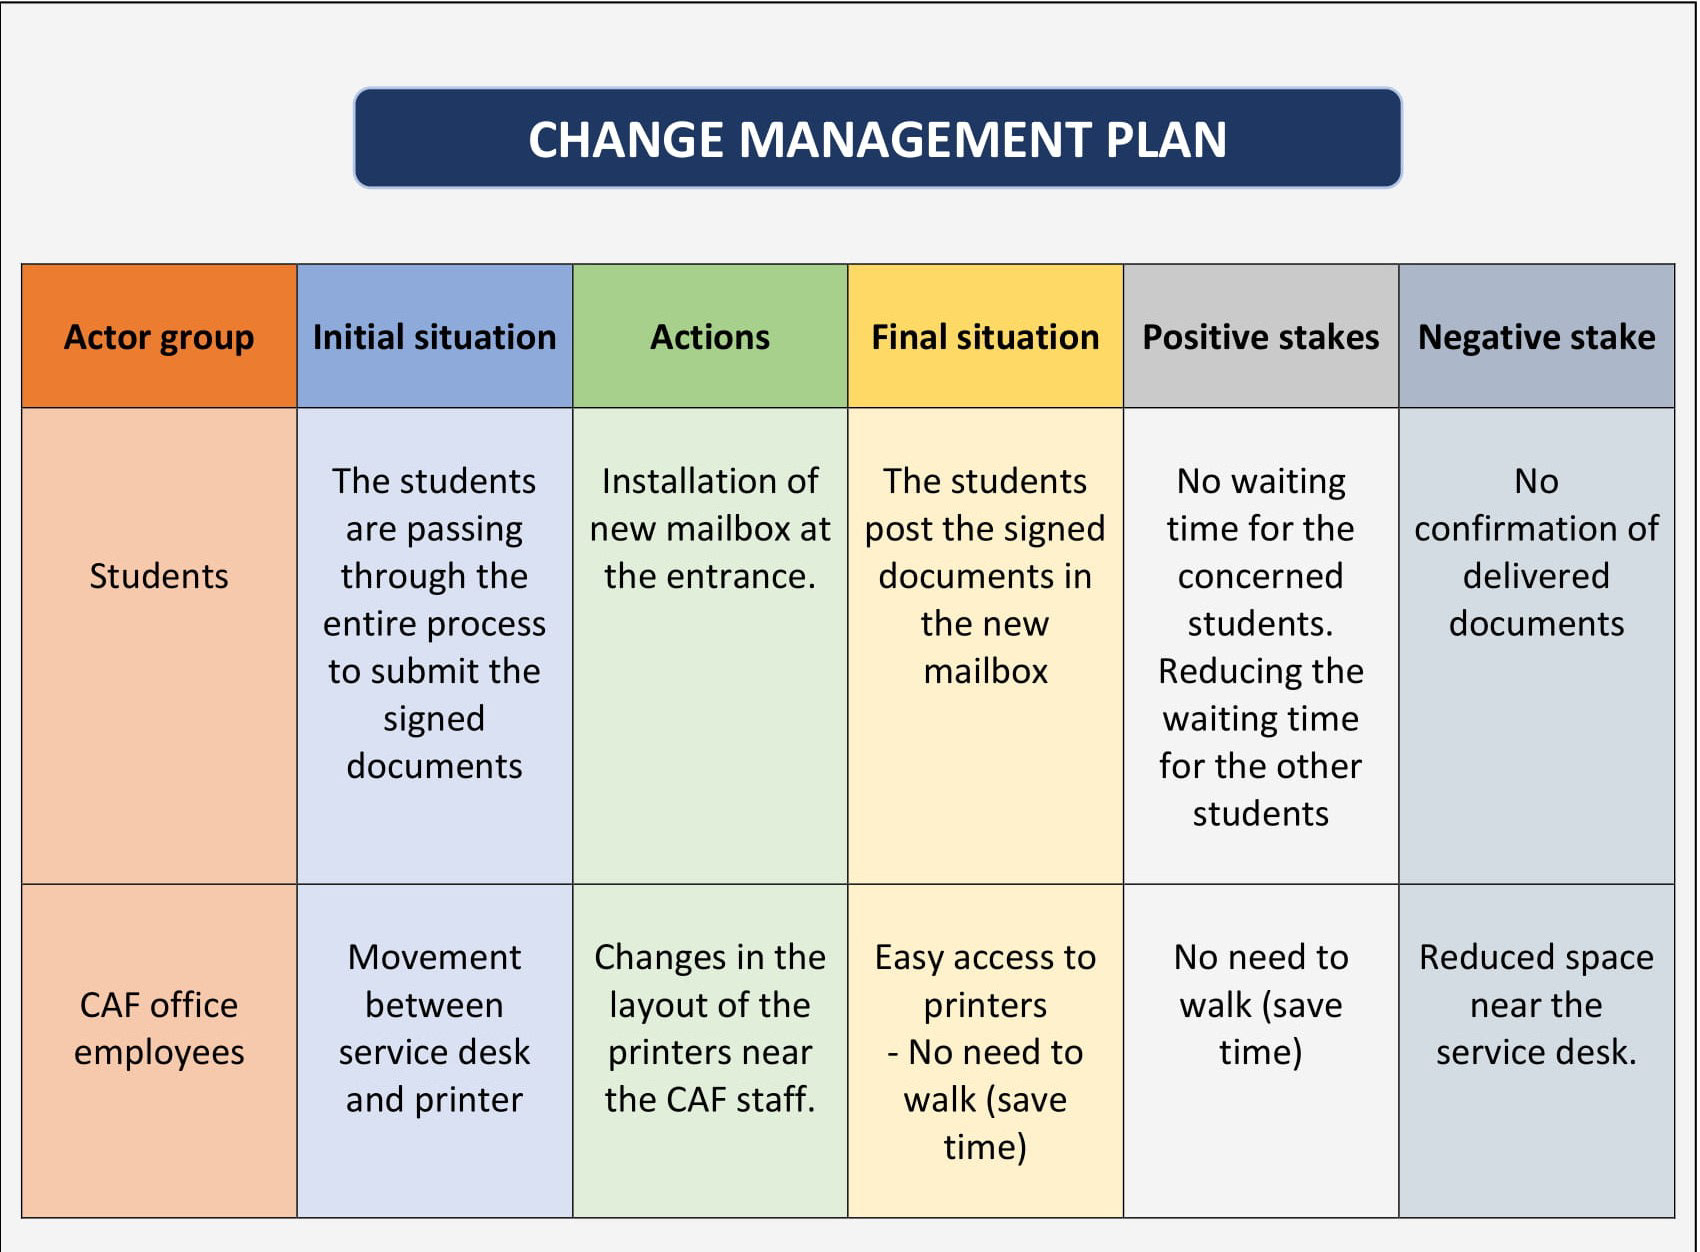
CHANGE MANAGEMENT PLAN
YOU CAN FIND OUR POWERPOINT PRESENTATION BELOW

